|
Autumn Morris Hypotheses and Motivation There are a lot of ways to obtain political information from a variety of sources. Each has differences in the ways they discuss political information, which might influence the general population's political opinions and perspectives, and influence voter turnout as well as decide who or what to vote for. In this way, it is important to look at how political information might influence voter turnout. My null hypothesis as it stands is political information frequency increases voter turnout in registered voters. It’s important to understand how political information impacts voter turnout, in terms of a sources’ potency and understanding of political affairs. And, in analyzing the significance of political information frequency in registered voters, we have a better understanding of its influence on voter turnout. Although, there’s only a little to none significance, there is an understanding that there’s a need for more data collection in survey takers. My dependent variable is registered voters among college students, and political information frequency as my independent variable. Lastly, my causal mechanism is efficacy, as I am analyzing the power of political information frequency. It is important to understand how frequency influences our understanding of political information as well as its sources, in terms of how often we tune into current affairs and research them. Empirical studies’ suggestions: Goldstein, & Ridout (2004) focuses on influences that derive from televised information on campaigns. They talk about biases and persuasion that is endeavored within the televised political information surrounding advertised campaigns. They suggest that many of the current measuring strategies are “flawed,” and talk through, as well as analyze the many measuring strategies. They also state that there are few studies conducted on “effects of television advertising on voter behavior and election outcomes” by political scientists (Goldstein & Ridout, 2004). They found within those studies that political influence does not derive from advertising and instead, small influences are derived elsewhere. The studies showed a significant amount of individuals’ exposure were “selective to political messages and political messengers mitigated the possible effects of election propaganda” (Goldstein & Ridout, 2004). The studies also showed that individuals’ voting choice was derived less than 100% of the backgrounds of both the person running for office, and of the party and showed no signs of “predisposition,” and instead, they focused their research on “national political and economic factors.” They mention that besides the lack of empirical evidence of campaigns and advertisements, individuals still suggest that campaigns and advertisements must matter and influence voters, because millions are spent on advertising. In Healy, & Malhotra (2013), they discuss retrospective voting, and how might voters determine government performance and act on those determinations. They review studies that cover retrospective voting over the past 10 years. They suggest that many individuals lack political information and are disinterested in politics. The literatures in review use controlled and natural experiments, and focus on the causes and effects, and concerns surrounding it and their biases. The authors build to research on Anderson’s (2007) economic voting, they suggest that “retrospection is moderated by the cognitive limitations of voters as well as political institutions.” Instead, Healy & Malhotra (2013), argue that “voters responsiveness to the economy (and other performance metrics) does not enhance public welfare per se.” They ask “Are voters reacting in the right way?” They attempt to answer the questions “How do voters evaluate government performance? What does this imply about the health of American democracy and the policies it produces?” Measurements and Methods My operational definitions are political information; and frequency. I will measure them through how often students read or watch political information. In understanding their presence/absence or levels through the causes and effects of students’ frequency of obtaining political information. The variables used are political information frequency [InfoFreq] and registered voters among college students. The data collected was in collaboration with other students on FLC Political Analysis Lab. There were in total, 160 respondents on the PAL 2020 Study of FLC Civic Engagement survey. Political information frequency [InfoFreq] is measured by “once a month or less” (0), “A few times a month (1), “once a week” (2), “a few times a week” (3), and “daily or more” (4). When asked “How often do you read or watch political information?” Registered voters are measured by yes (1), no (0), and unsure (.5). And, when asked “Are you currently registered to vote?” To find if political information increases voter registration I tested information frequency among registered college students using the independent sample test, in order to find any indication of political information influences. This test will determine if [InfoFreq] is either higher or lower among college students who are registered to vote. Results and Analysis: In figure one, the graph shows that there is little significance with [InfoFreq] in registered voters among college students. This means that political information hardly impacts voter turnout in registered voters with a result of yes registered voters. 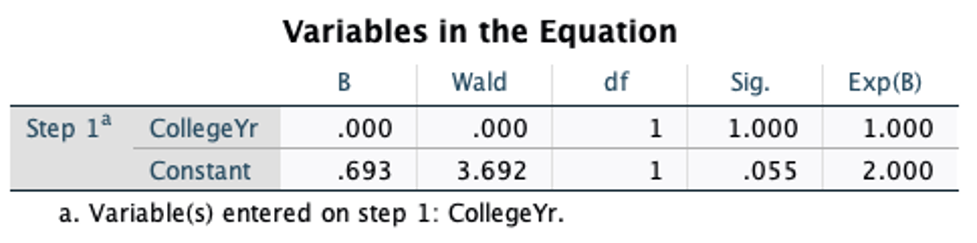 (Figure one) In figure two we can see that there are 13 college students who did not register to vote and a total of 156 college students who did register to vote. 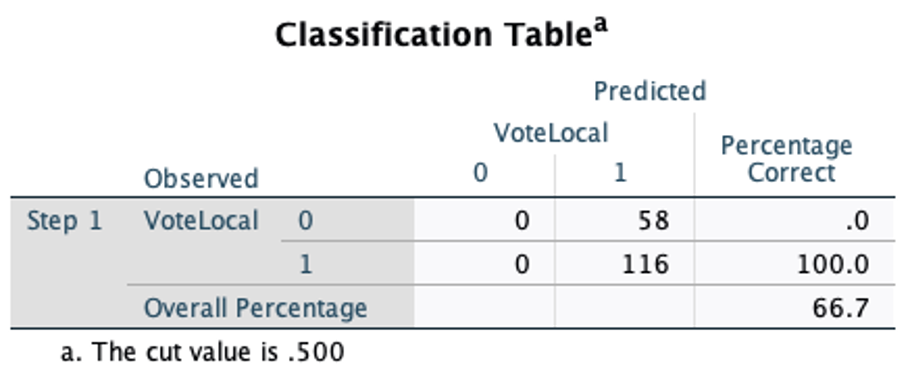 (Figure two) In figure three, the independent sample test indicates that there was little significance with the tested variable, information frequency, and test group, registered voters of (.165) and (.158). The p-values are greater than 0.05, which is an indication that there is no significance here. With this understanding there is a rejection of the null hypothesis that political information frequency increases voter turnout in registered voters in figures three and four. 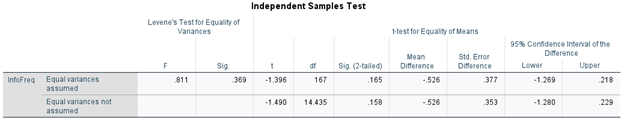 (Figure three) 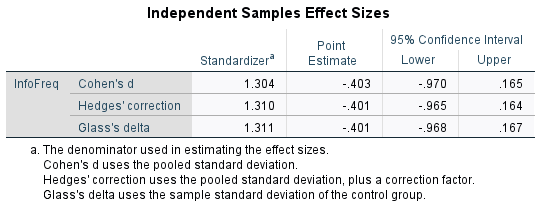 (Figure four)
Conclusion There is a need for more data collection in order to best determine if political information increases voter turnout in registered voters among college students. In this way, there is no significance and a rejection of the null hypothesis. Although, it is interesting to think that if political information did increase voter turnout, there would be a great need for a well reliable source of political information, to not only increase voter turnout but to determine our political opinions and perspectives. Citations: Goldstein, K., & Ridout, T. N. (2004). Measuring the effects of televised political advertising in the United States. Annual Review of Political Science, 7, 205–226. https://doi.org/10.1146/annurev.polisci.7.012003.104820 Healy, A., & Malhotra, N. (2013). Retrospective voting reconsidered. Annual Review of Political Science, 16, 285–306. https://doi.org/10.1146/annurev-polisci-032211-212920
0 Comments
Milo Adams Students on college campuses have access to some of the most robust public forums maintained in the country, and often have more opportunity and resources to understand and discuss politics than the typical person. However, this doesn’t mean that all college students are equally engaged when it comes to politics and voting- some students choose to consistently avoid the polls come election day. Among the general public, discussing politics with others face-to-face seems to have a positive effect on engagement. College students, with their improved access to tools and resources, are not the typical American citizen. Therefore, it is of great interest to assess the influences of such discussion of the voting behaviors of students here at Fort Lewis College. Here, this is determined through measurement and analysis of the following hypotheses: Null Hypothesis: political discussion and face-to-face interactions with others are not related to voter turnout among college students Alternate Hypothesis: political discussion and face-to-face interactions with others is related to voter turnout among college students Review of the Literature Previous studies have effectively identified the common forms of voter outreach and mobilization, and the most effective strategies of driving voters to the polls. A seminal piece from 2000 by Gerber & Green introduces forms of physical voter contact including telephone calls, direct mailings, and canvassing (which entails door-to-door contacting of voters), and from a GOTV field study finds canvassing to be the most effective approach in terms of increasing voter turnout. Further studies have found face-to-face voter contact to be the single most effective form of GOTV efforts in city elections. A study published by Niven in 2004 assessed the impact of canvassing through a field experiment which focused on contacting unregistered citizens or voters who had not voted in recent elections, and found that this group of voters in specific was most sensitive to face-to-face contact, and these efforts were positively correlated with better turnout in a municipal election. The question remaining is what role this plays on a college campus, which hosts a unique demographic of voters, and what type of face-to-face interactions are most effective. College campuses, and Fort Lewis in particular, are forums for discussion and provide many resources for political information and debate which are not so readily accessible or easily-understood by the regular public. One would expect this type of forum to influence a person’s motivation to vote or not vote, and for the specific type of discussion to influence this effect; in other words, who do people need to be talking to about politics for it to influence their voting behaviors? To answer these questions, we analyze here the self-reported voter registration status of FLC students in relation to their frequency of political discussion in either a familiar and personal setting, or in a public setting, to determine whether student activities are related to engagement. Methods The independent variable used to test the hypothesis is voter registration status, or whether a person is registered to vote (in any state). In the data, registration is represented numerically where 0 = Unregistered, 0.5=Unsure/Don’tKnow, and 1 = Registered. To determine voter registration status respondents were directly asked whether they were currently registered, in any state, to vote. The two dependent variables measured are personal and public discussion. The first is defined as political discussion in a public setting, which does not include family and friends but interactions with others such as with classmates or coworkers. Personal discussion, on the other hand, is defined as political discussion with others in a personal setting such as family and friends. Frequencies for both variables were determined by asking respondents to report on a numeric scale the approximate number of times they had discussed the upcoming 2020 General Election with the relevant parties in the last 30 days. The values of these numbers in terms of actual discussion frequency is as follows: Every Day = 4 More than once a week, but not every day = 3 3-5 times (about once a week) = 2 Once or twice = 1 Never = 0 Unsure/Don’t Know = 0.5 A relationship between the independent and dependent variables was assessed using a 2-tailed t-test to compare the mean scores of discussion frequency. For the sake of avoiding miscalculations and clarifying results, any responses of Unsure/Don’t Know were omitted from this statistical test since it provides a non-zero result which does not contribute to discussion frequency, and is reported by an extremely small sample of the population. Results The difference of means test produced mean differences in discussion frequency of 0.728 and 1.106 between voters and nonvoters for personal and public discussion, respectively. However, with reported p-values of 0.09 and 0.00, the variation in personal discussion between non-registered students and registered voters is not significant, but the variation in public discussion by registration status is statistically significant. In terms of actual discussion frequency, registered voters reported on average that they have discussed the election in a public setting between once and several times a week, while nonvoters have engaged in these discussions with classmates or coworkers far less frequently (less than once per week). 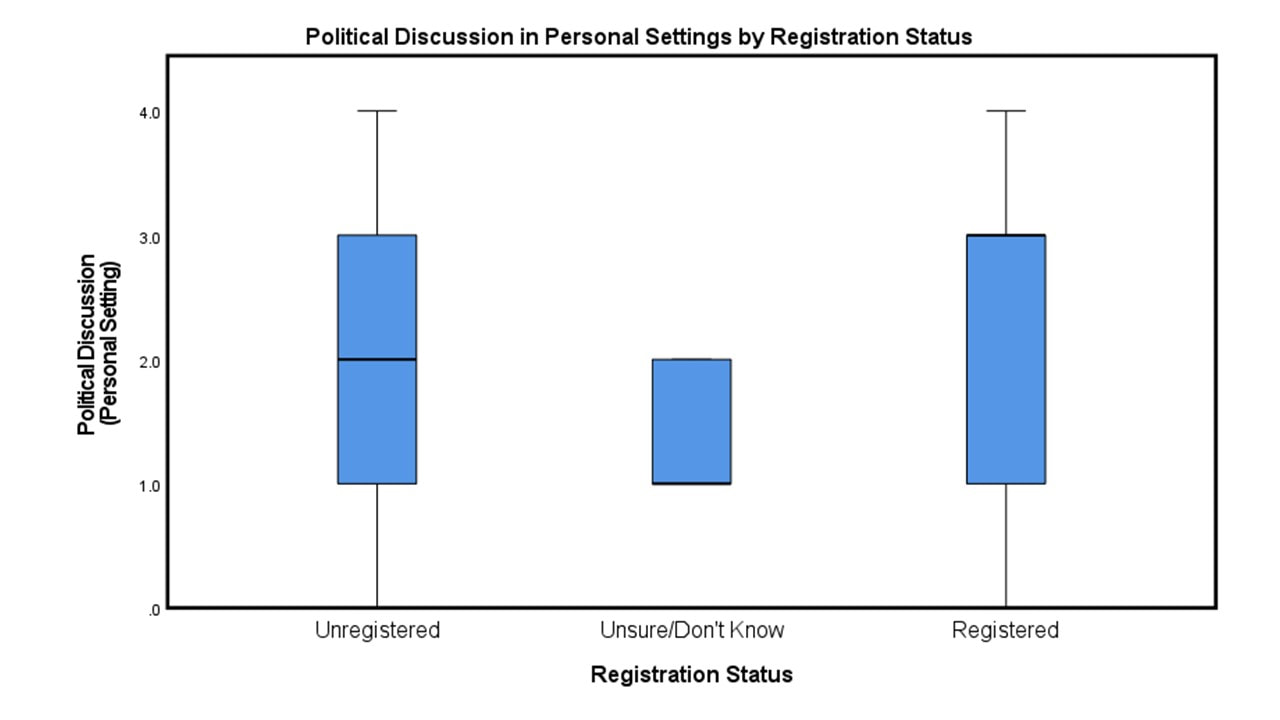 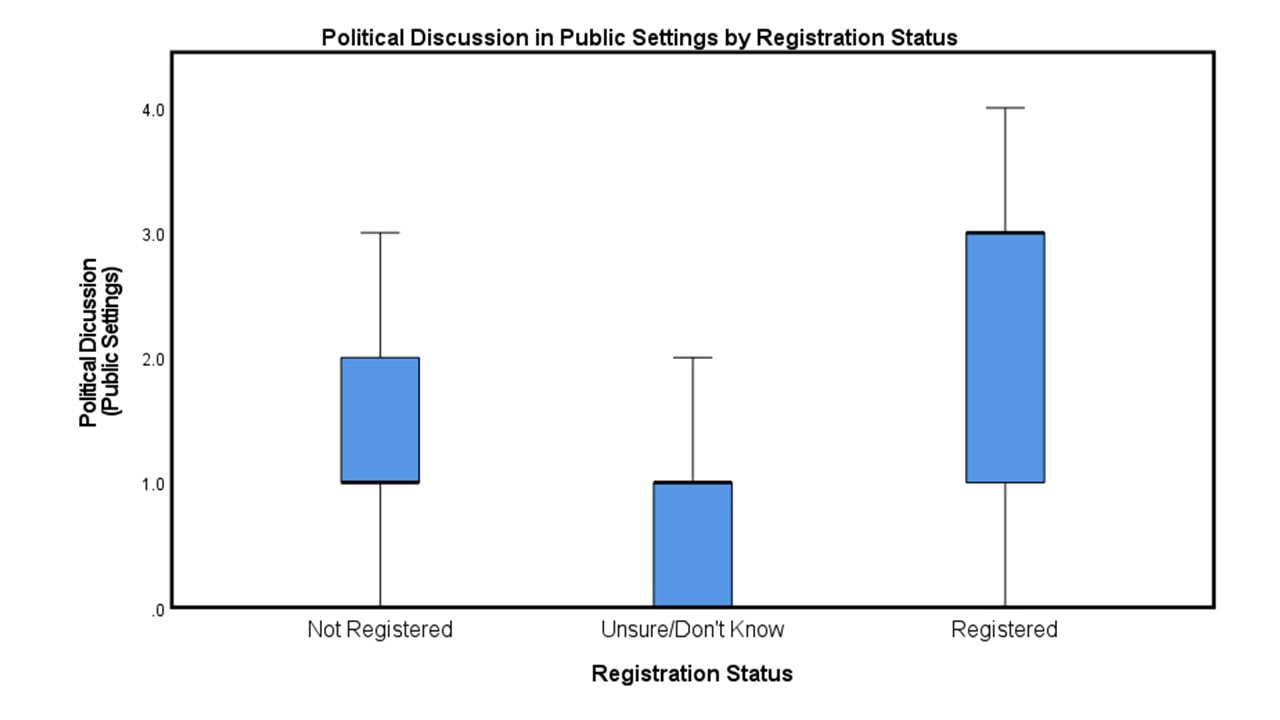 These differences in discussion frequency between voters and nonvoters are well-captured in box-and-whisker plots, where means can be easily distinguished and an unexpected and interesting trend emerges. While the range of responses is the same for personal discussion (meaning while the means differed, there were some nonvoters who discuss politics frequently, and voters who discuss politics infrequently), the range is much lower among nonvoters, meaning even the nonvoters who frequently discuss politics with family and friends do not frequently discuss the same issues in public settings with classmates or coworkers. While the responses of “Unsure/Don’t Know” were originally handled as extra data, the above plots made clear that those having political discussions most infrequently are those who are unsure of their registration status. One important note in interpreting these results is the sample size of registered vs unregistered students; the data was influenced by selection bias, wherein students interested in politics were most likely to opt into completing a political engagement survey. The difference of means test was chosen for this specific reason to avoid any inaccuracies due to the small sample size; however, it should be noted that this is not an entirely representative sample of the FLC student population. 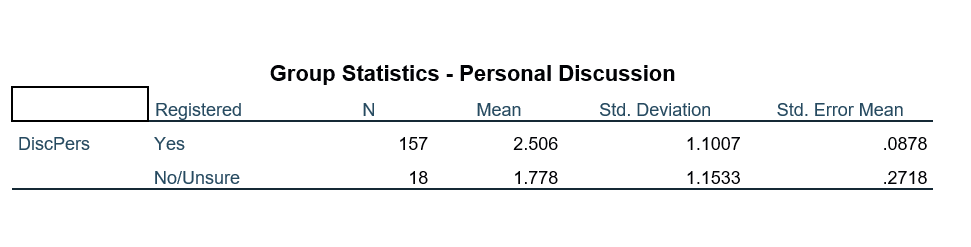 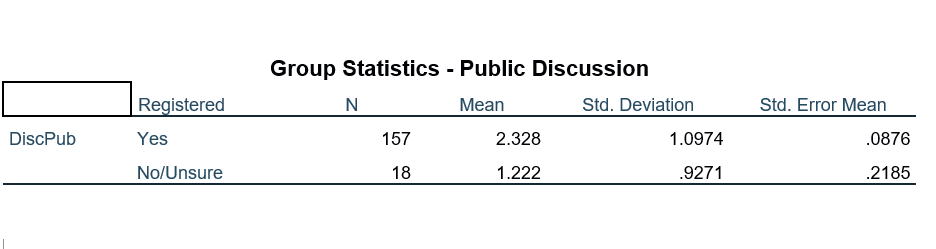 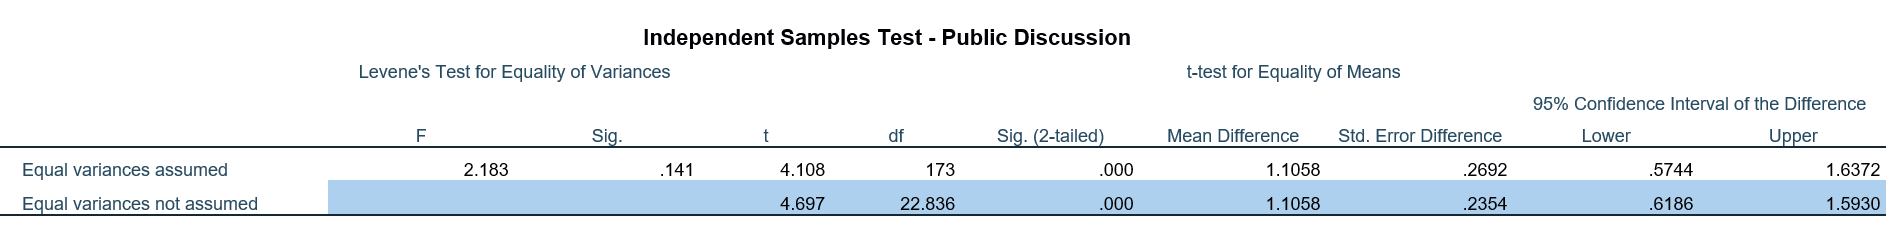 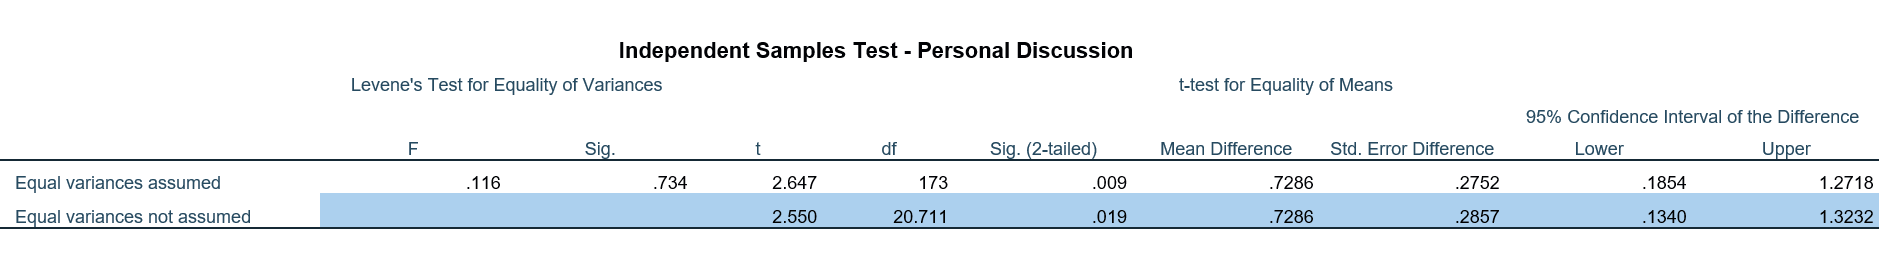 Concluding Thoughts
Overall the results lead us to conclude that registered voters, unsurprisingly, tend to discuss politics more frequently than those who are unregistered. This difference is statistically significant when it comes to public but not personal discussion, suggesting unregistered voters do engage in political discussions almost as frequently, but tend to keep their thoughts within their own social circle. Interestingly, and a result which had not been anticipated, those who are unaware of their registration status have political discussions most infrequently. The question which arises from these results is in regard to the causal mechanism; do these students talk less about politics because they’re less engaged, or are these students less engaged in politics because they rarely talk about them and therefore have limited information? For those who are unaware of their status and who don’t engage in much discussion, is this lack of awareness due to a lack of information and understanding of how to register or to know your registration status, or due to a lack of desire to be engaged? These are intriguing questions which beg further research in the future. References Gerber, A., & Green, D. (2000). The Effects of Canvassing, Telephone Calls, and Direct Mail on Voter Turnout: A Field Experiment. The American Political Science Review , 94(3), 653-663. Niven, D. (2004). The Mobilization Solution? Face-to-Face Contact and Voter Turnout in a Municipal Election. The Journal of Politics , 66(3), 868-884. Sophie Schwartz The age of information, and specifically digital information, has dramatically shaped countless features of our modern lives. Social media, in particular, has seemingly infiltrated a number of our behaviors and subsequently shaped our real-world actions. Given the power that digital information spheres have, it seems of paramount importance to inquire into the ways in which our political action may be affected by this phenomenon. My primary interest is in understanding how this trend might affect the political behavior of college students; most of which happen to be the first generation raised within this digital information age. My hypotheses are as follows: Null hypothesis: There is no correlation between "get out the vote" posts/messages on social media and increased voter turnout among college students. Alternative hypothesis: There is a correlation between "get out the vote" posts/messages on social media and increased voter turnout among college students. Review of the Literature The questions surrounding the political impacts of social media are hardly new. In 2010, a group of academics sought to answer just such questions, and thus the formative article, "A 61-Million-Person Experiment in Social Influence and Political Mobilization" was born (Bond et al., 2012). This experiment constitutes a seminal piece of work that draws conclusions about messages on social media and its effects on voter turnout. By using public voting data, two treatment groups and a control group that totaled 61 million subjects, messages on Facebook (of two kinds) were sent to the treatment groups respectively. The study finds that messages encouraging those to vote, while also showing them which friends/family had already reported voting (social message group), were significantly effective in boosting voter turnout. Those who received no message (control group) and those who received a general message encouraging them to vote not linked to their friends/family (informational message group), had lower turnout than the social message treatment group (Bond et al., 2012). A similar attempt to understand the relationship between social media and voting behavior was studied by Teresi and Michelson in their article, "Wired to mobilize: The effect of social networking messages on voter turnout" (2015). This study focused, once again, on social messages sent to a treatment group through Facebook, encouraging subjects to vote. This study used impersonal messages (messages not from or associated with friends/family) and it was conducted on strictly undergraduates. The results yielded a substantial increase in voter turnout for those individuals exposed to the "get out the vote" messages (Teresi & Michelson, 2015). Both studies are highly similar to my project and research, insofar as they seek to measure the relationship between "get out the" vote posts on social media and voter turnout primarily. Before explaining my variables and methods in more depth, I'd like to say a word on the important implications of my hypothesis. This hypothesis test is important for understanding some potential solutions to low voter turnout, especially within the FLC student community. It is also helpful to the FLC Engagement Collaborative in judging how effective some of their social media tactics might be and how responsive our student population might be. Lastly, this project has the potential to be illuminating in regards to understanding the different ways college students might participate in the democratic process via their digital spheres. Methods I'll now turn to explaining the variables I used in my research and my methods. My independent variable is identified as "get out the vote" posts/messages on social media, represented as "SMVote". This is defined in my project as posts or messages on social media that encouraged respondents to register to vote or to vote. My dependent variable is voter turnout which was measured in a "yes" or "no" binary and represented as "Vote2020YN". To measure my independent variable, a question was asked (with a total of 160 respondents) which read, "Leading up to the election, how frequently did you come across posts on social media that encouraged you to register to vote or to vote?" and the corresponding answers were a 1 to 5 scale - 1 being "Never" and 5 being "Very Often". This variable, then, is a scalar, numeric measure on the frequency at which respondents self-report seeing "get out the vote" posts. My dependent variable on voter turnout was measured through a question asked (with 160 respondents) about turning out to vote, which read, "Now we'd like to ask you about the elections to be held on November 3. Have you voted or do you intend to vote in those elections?" The response options were "Yes, I have already voted"; "Yes, I plan to vote"; "No, I do not plan on voting"; "I’m not sure / don’t know". This was boiled down into a dichotomous variable in which "Yes" were those who had reported already voting or intent to vote. "No" were those respondents who did not intend to vote or were unsure. This numeric, nominal variable is the most helpful in a "yes" or "no" configuration to most effectively measure "voter turnout" for the purposes of my hypothesis test. Lastly, one other independent variable was measured that was not related to "get out the vote" posts strictly, but was a measure of total social media use, and is represented as "TotalSMSource". This variable was identified by asking (with a total of 175 respondents), "Which social media sites do you use? (Check all that apply)". The response options were "Facebook", "Instagram", "Twitter", "Snapchat", "TikTok", "YouTube", "Don't Use Social Media" with an "Other" response option that generated two additional options, "Discord" and "Reddit". Each respondent was then assigned a numeric value for the total number of responses checked, with the lowest possible number being "0" and the highest possible number being "8". Results A Pearson Correlation test was used to test my hypothesis, looking at the variables of voter turnout and frequency of "get out the vote" posts. 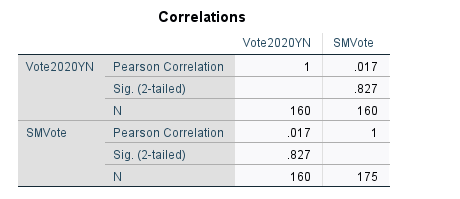 The Pearson Correlation test suggests that there is a very small positive correlation between voter turnout and frequency of seeing "get out the vote" posts, at only 0.017. The p-value at 0.827 is much larger than 0.05, meaning that this test is not statistically significant. Therefore, I fail to reject the null hypothesis. It is likely, due to self-reporting and the repetitive nature of "get out the vote" posts, that those surveyed feel as if "get out the vote" posts are moot in the grand scheme of their own voting behavior. The high reported mean suggests that "get out the vote" posts could be excessive, overdone and therefore not actually effective. To visualize my findings, I have created the following bar graph. This graph illustrates the mean frequency of respondents seeing "get out the vote" posts, categorized by voters (1) and non-voters (0). The mean frequency of seeing "get out the vote" posts is roughly the same for both groups: 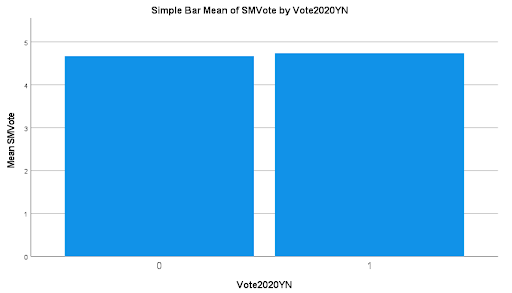 Another Pearson Correlation test was run on the variables of voter turnout and total social media use: 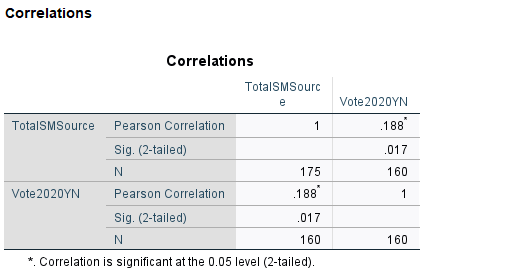 This test suggests another small, positive correlation of 0.188 between voter turnout and total social media use, so not a strong correlation by any means. Though, the p-value of 0.017 is highly statistically significant. So, this test suggests that at least social media use in the aggregate may be more effective in impacting voting behavior. To visualize this finding, I generated another bar graph that shows the mean of total social media sources, categorized by voters (1) and non-voters (0): 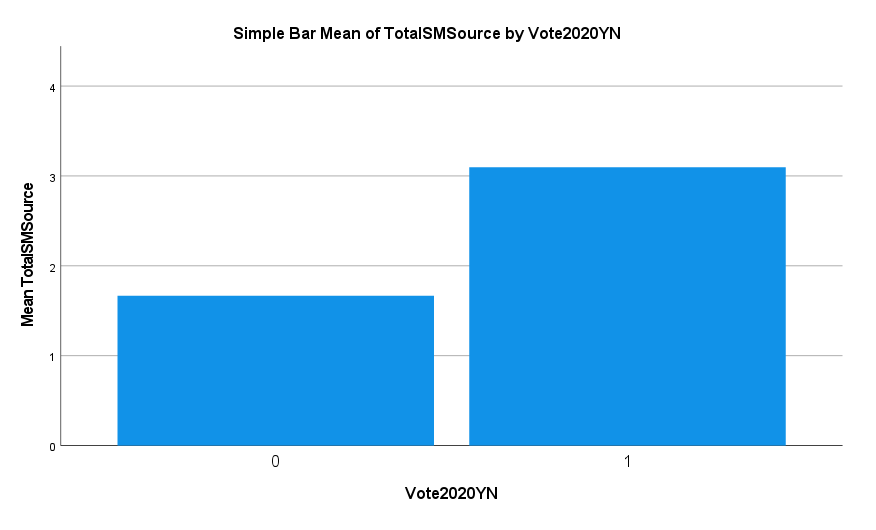 This graph elucidates the difference between social media use of voters and non-voters; namely the fact that voters use more social media than non-voters.
Concluding Thoughts While the results of my research showed there was no correlation between "get out the vote" posts and increased voter turnout among college students, there is still potential to explore the more significant effect that social media use in total might have on voter turnout among college students. Further research in this area, especially within the demographic that I have proposed, may have some powerful implications for our understanding of democratic processes in the digital information age. References Bond, Robert M.; Fariss, Christopher J.; Jones. “A 61-Million-Person Experiment in Social Influence and Political Mobilization.” Biology Digest, September 13, 2012. https://search.ebscohost.com/login.aspx?direct=true&db=edsnbk&AN=14322C34E3A6A9C8&site=eds-live&scope=site Teresi, Holly, and Melissa R. Michelson. 2015. “Wired to Mobilize: The Effect of Social Networking Messages on Voter Turnout.” The Social Science Journal 52 (2): 195–204. doi:10.1016/j.soscij.2014.09.004. |
