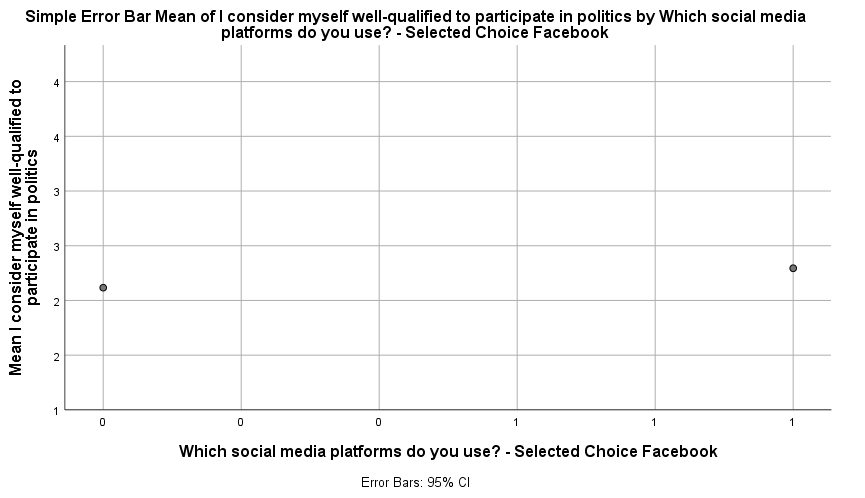
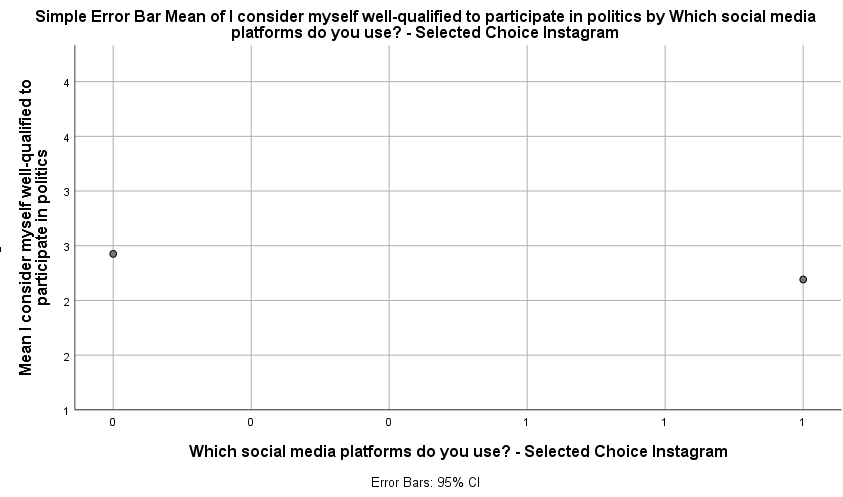
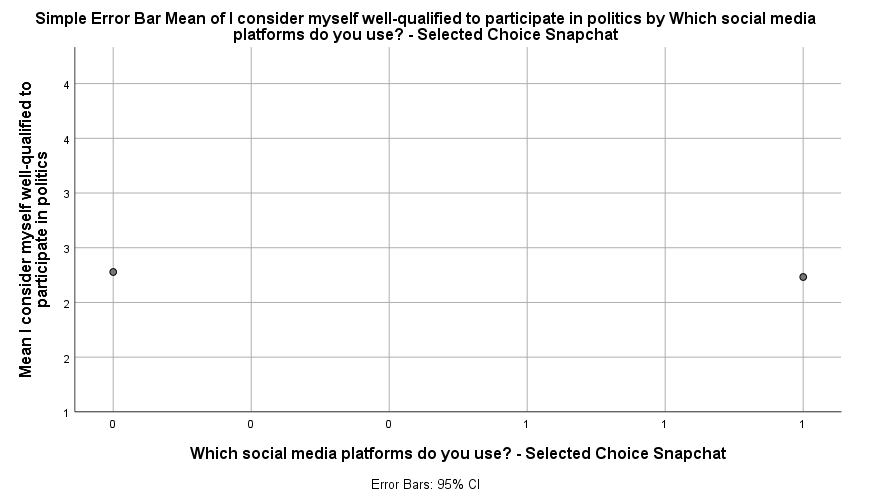
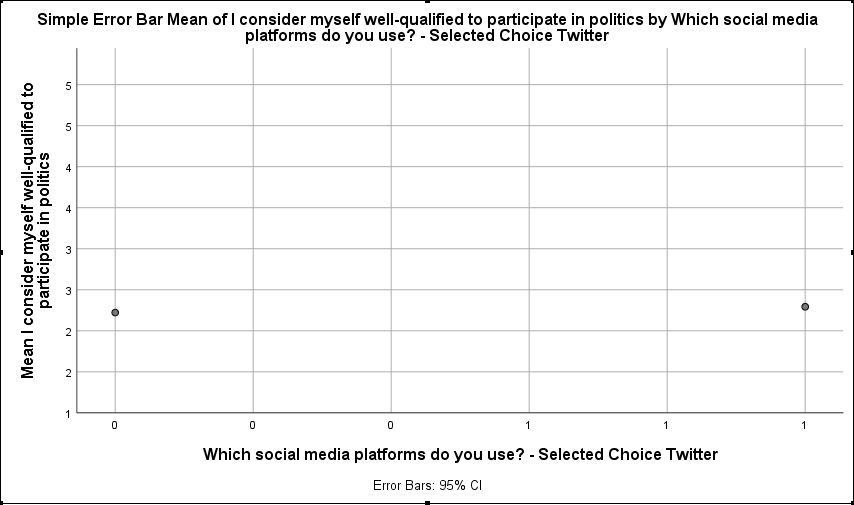
Dorothy ElderAs we collect information around why college students do or do not vote, one of the variables explored was evaluating how qualified students felt they were to participate in politics. As social media has come to the forefront in idea-spreading and mass-communication, I decided to test if users of certain social media platforms feel more qualified to participate in politics than users of other social media platforms. Therefore, my null and alternative hypotheses are as follows; Null hypothesis: There is no correlation between how qualified respondents feel to participate in politics and their social media of choice. Alternative hypothesis: There is a correlation between how qualified respondents feel to participate in politics and their social media of choice. In order to test the hypothesis, our independent variable is the respondent’s social media of choice. Our dependent variable is how qualified the respondent feels to participate in politics. Therefore, the causal mechanism, in theory, is that a college student’s social media platform of choice causes the amount the student feels qualified to participate in politics because certain social media platforms offer more or less information about politics or access to information about politics depending on the platform’s design or goal. A collaborative study done by multiple universities in Pakistan suggested that college student’s online political activities strongly correlate to political awareness and offline political participation (Ahmad, 2019). Thus, there is reason to believe this causal mechanism is valid. In a study done by the University of California, Santa Barbara, researchers sought to find a correlation between digital media and political participation, and found that there is no statistically significant relationship between digital media use (in general) and political participation in college students (Bimber, 2011). In the study’s conclusion, the researchers suggest that there is strong evidence that the relationship between digital media and political participation is idiosyncratic (Bimber, 2011). Thus, it is appropriate to further the study’s findings by breaking down digital media use by platform, to find if a singular platform yields more political participation, or feeling of qualification to participate in college students. Overall, our hypothesis is important as we try to understand why some college students do not participate in politics by hopefully identifying one or more of the independent variables (social media platform of choice) as a causal mechanism for lack of political participation. This could help us understand the low voter-turnout rate at our own Fort Lewis College, and lead us to ideas around how to increase political participation at the college. We are using a survey of 409 college students to evaluate a potential correlation between social media platform of choice and how qualified the survey taker feels to participate in politics. The independent variable is the social media of choice. Survey respondents had the options of Facebook, Twitter, Instagram, Snapchat, and Other. The question that survey respondents saw was “Which social media platform do you use?” The dependent variable is how qualified the survey takers felt to participate in politics. Survey respondents rated their qualification on a scale of 1-4, 1 being the least qualified and 4 being well qualified. The question that survey respondents saw was “I consider myself well-qualified to participate in politics..”, and the aforementioned scale followed the question. It is important to note that respondents were not actually rating the level to which they actually participate in politics, rather the question aimed to understand the respondent’s sense of qualification. Thus, our results will only reflect that, and so we cannot make any conclusions that state that certain social media platforms yield more political participation. The hypothesis reflects this limitation. Results A Pearson correlation test was used to test the hypothesis. 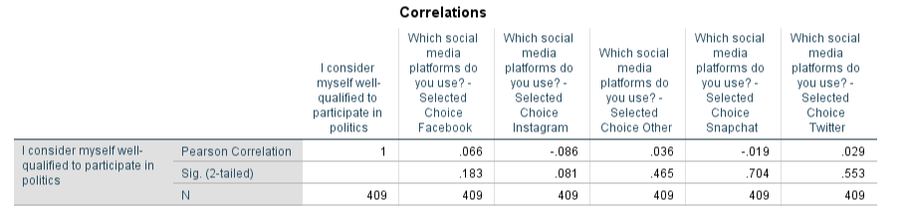 The column, Pearson Correlation is what we are testing for statistical significance. Statistical significance at the .05 level, is indicated by the symbol, **, which is not present for any of the results. Thus, our conclusion is: We fail to reject the null hypothesis at the .05 significance value. However, we can still use our data to give us an idea of which social media platform choices had users that felt more qualified to participate in politics. The highest values in the 'Pearson Correlation' column indicate that these users feel the most qualified to participate in politics. It follows, that our findings suggest Facebook users feel the most qualified to participate in politics, followed by 'Other', followed by Twitter, followed by Instagram. Snapchat users felt the least qualified to participate in politics. Granted, none of these findings are statistically significant, so we are limited to acknowledging these results without validating them. Still, these findings could prompt further research into the independent variables that yielded almost significant results, like Facebook and Snapchat. The following are graphs that compare the mean answer to 'I consider myself qualified to participate in politics' (on the left) and the answer to the same question, but only including responses from those who prefer the social media platform that is shown in the label of the graph (on the right). References
Bimber, B. & Copeland L. (2011). Digital Media and Political Participation Over Time in the US: Contingency and Ubiquity. University of California, Santa Barbara. Retrieved from https://ecpr.eu/Filestore/PaperProposal/db466b6c-9c16-4491-b92a-32f1b0e80273.pdf. Ahmad, T., Alvi, A., & Ittefaq, M. (2019). The Use of Social Media on Political Participation Among University Students: An Analysis of Survey Results From Rural Pakistan. SAGE Open. https://doi.org/10.1177/2158244019864484
0 Comments
By - Mitchel Pink Literature Review – When combing through the existing literature pertaining to voter turnout on college campuses, it was found that there existed to main schools of thought. The first stemmed from Verba’s Resource Model. According to Sydney Verba, voting habits are best determined by the resources available to any given individual (Brady, 1995). “The resources considered are time, money, and civic skills—those communications and organizational capacities that are essential to political activity. These skills are not only acquired early in life but developed in the nonpolitical institutional settings of adult life: the workplace, organizations, and churches and synagogues.” (Brady, 1995). Those who are more established within society are the ones more likely to have the resources available to them to afford to turnout to vote. This approach is very much set in a demographic outlook that is best focused on looking at general and broader populations. The alternative theory, and one that stems from a seminal work, is put forward by Niemi and Hanmer in their study Voter Turnout Among College Students: New Data and a Rethinking of Traditional Theories. They argue that “ Traditional theories of turnout are of limited applicability to college students: the concepts and measures associated with these theories were not designed with students in mind, and factors not considered by the traditional theories are relevant. ” (Niemi, 2010). This is because the traditional methods, while good for assessing large populations, is to narrow to adequately study a sub-groups such as college students. They propose the use of more descriptive statistics to assess a smaller and more specific populations. They are able to show merit for this by suing factors more relevant to college students, such as their degree of study, their distance from campus, in-state vs. out-of-state, etc., were just as viable for predicting the voting habits of students, if not more so than traditional demographic factors. Hypothesis – A higher percentage of STEM majors at a given college will lead to lower voter turnouts and/or lower registration rates, showing that college specific factors might offer a better explanation to why some Colorado colleges lag behind the national average for voter turnout than traditional demographic factors will. Null Hypothesis – The percentage of STEM majors at a given college does affects neither voter turnout nor registration rates, showing that college specific factors might not offer a better explanation to why some Colorado colleges lag behind the national average for voter turnout than traditional demographic factors will. Significance – Understanding why some college campuses continue to lag behind in voter turnout will help us to find solutions that will be more effective at encouraging voter turnout and civil engagement. Dependent Variables – Registration rate and voter turnout rate for the election years of 2014 and 2018 Independent Variable – Percentage of 4-year STEM graduates for the years of 2014 and 2018 Methodology – For my part in the PAL project, I attempted to assess to what extent college specific factors may better explain why some colleges are lagging behind the national average for voter turnout despite the implementation of policy reform to make voting more accessible to Colorado voters. This is because this data is more available for consecutive years than any of the other variables stated within the college specific factors theory. To this end, I chose to focus on a single factor, whether a student’s major will affect the likelihood they are to turn up to vote as well as register to vote in the first place. I chose to focus on both because I was curious if they would follow a similar trend. If they did not, then it could suggest that the root issue may not lie where we initially thought it to be. More specifically, if it we found lower registration rates carried a more significance rather than voter turnout. Due to constraints in collecting data that in a large part stemmed from a restricted access, I chose to narrow my focus upon graduation numbers rather than total enrollment. My thought process was that if the hypothesis held true for those set to graduate with a bachelors from a 4-year college, the possibility exists that it may be reflective of a larger trend amongst the larger student body. I was able to gather this data from the Dept. of Education’s Integrated Postsecondary Education Data System (IPEDS). The IPEDS does not offer numbers for enrollment per degree but does for degrees earned in a given year alongside the total number of those who graduated. I chose to collect the data rom STEM majors because, according to the literature, those studying STEM are least likely to turn out to vote. For voter and registration turnout, I turned to the National Study of Learning, Voting and Engagement (NSLVE), conducted by Tufts University. The NSLVE is a survey of the election engagement of college students. The survey has been carried out since 2012, and this is adequate because that covers the time in which the State of Colorado has enacted its election reforms. From this, I extracted the voter turnout and the rates of registration for comparison to the data pulled from the IPEDS. An issue I encountered here is that Tufts University had ceased making all data available for each college, requiring me to contact the individual colleges to collect the relevant data, not all of which I was able to collect. Results – There is a negative correlation between the percentage of graduating STEM majors and both the rates of voter turnout and voter registration. This initially suggests that there may in fact be a relation between STEM majors and students not turning out to vote. However, neither of the data sets carry any statistical significance strong enough to confidently rule out this being mere chance. This is likely due to only pooling from seven colleges for my samples. The regression was a reflection of the correlation. Further study will need to be done to determine if there does exist a strong correlation. This would require not only increasing the number of colleges we are assessing, but potentially broadening our scope beyond just the State of Colorado. Below I have included the graphs for the 2018 data pertaining to this study. Displayed are the graphs for how both voter turnout and registration rate correlate to the percentage of STEM graduates. Voter turnout carried a p-value of -0.535, while registration carried a value of -0.340. While the 2014 variables carried larger p-values, the 2018 variables had higher scores of statistical significance. However, because neither scored high enough to discount chance, more research will need to be carried out before a definitive conclusion is to be reached. 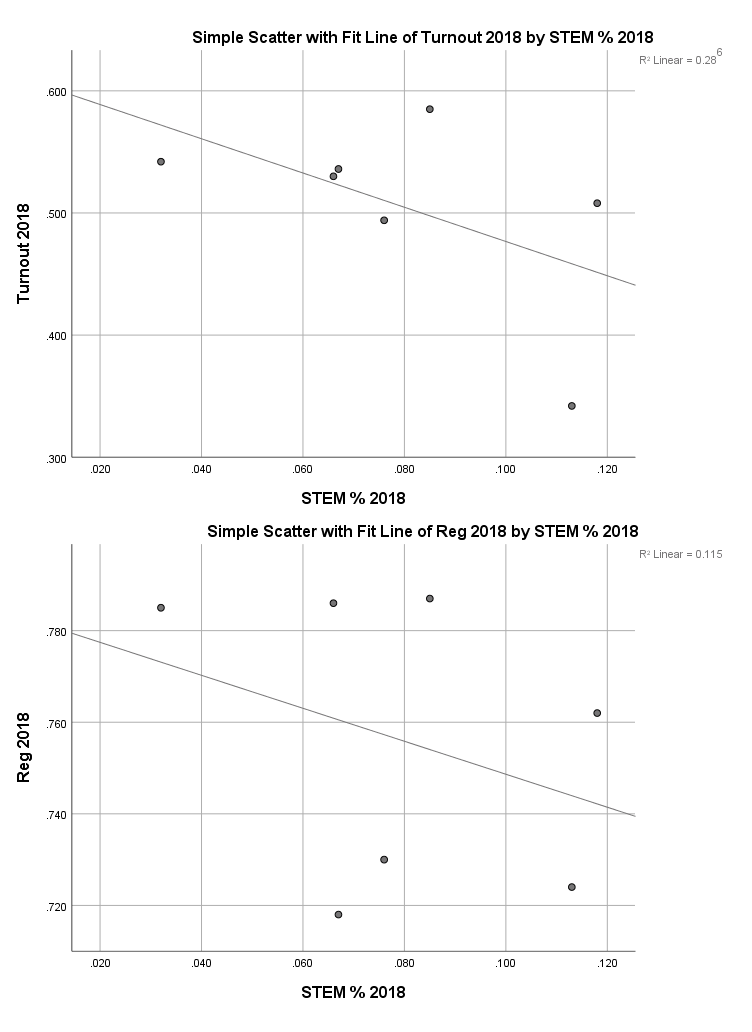 Bibliography
Author: Emilio Anaya Hypothesis: An increase in dissatisfaction with how politicians engage with their electorate, leads people to become more interested in politics. Null Hypothesis: There is no correlation between one’s level of dissatisfaction with how politicians engage with their electorate and how interested they are in politics. Brief Literature Review: When studying whether dissatisfaction impacts political interest, we are essentially looking in to how a specific emotion might impact political interest. In the 2012 study, Emotions, Campaigns, and Political Participation, emotion is found to play a very significant role in the political activity and civic participation of the American electorate (Weber, 2013). In studying how anger, sadness, fear, and enthusiasm in political advertisements impacts the political behavior of the electorate, anger was unique in that it was the only emotion to increase the likelihood that someone would become more “politically active” (Weber, 2013). This is significant in the context of this research because when considering the four emotions used in Weber’s research, anger is the emotion that is most likely to be elicited as the result of dissatisfaction. With this assumption in mind, it seems that Weber’s research would support my hypothesis, especially because he uses interest in politics as a variable in a person’s overall political activity. Another piece that might shed some light on my research question is a study that looked in to how conditions in the labor market (employment, wages) impact voter turnout (Charles & Stephens, 2013). This study found that as local per capita earnings and employment increased, voter turnout decreased in congressional and senatorial elections (Charles & Stephens, 2013). When examining these results from the perspective of my own research question, one might interpret this to mean that as people become less dissatisfied with there economic situation, they become less involved in politics. This is not the conclusion that the authors in this study draw. Instead, the authors conclude that this phenomenon occurs because people who are employed and who are earning more have less leisure time and therefore have less time to become interested in political matters (Charles and Stephens, 2013). Significance: In the last decade, there has been an increasing sense among the general American population that Washington politicians are too partisan and no longer truly reflect the diverse spectrum of opinions and ideologies that are encompassed in their electorates. If we want to have a better understanding of the state of our democracy, it is important to ask ourselves how this effects the dynamics of the American political arena. This hypothesis test could help towards giving some insight towards that question if we are able to reject the null hypothesis, Methodology: In testing my hypothesis, I utilized data from the Fort Lewis College PAL 2018 Survey which surveyed 419 students about different aspects of their civic engagement. Levels of dissatisfaction with how politicians engage with their electorate is measured by responses to the statement, "those we elect in Washington lose touch with the people." Responses to this statement are measured on a 5-point Likert scale where 1= strongly disagree, 2= disagree, 3= neutral, 4= agree, and 5= strongly agree. Someone's interest in politics is measured by responses to the statement, "in general how interested are you in politics?" Responses to this statement are measured on a different 5-point Likert scale, where 0= not at all interested, 1= slightly interested, 2= moderately interested, 3= very interested, and 4= extremely interested. Results: Table 1: 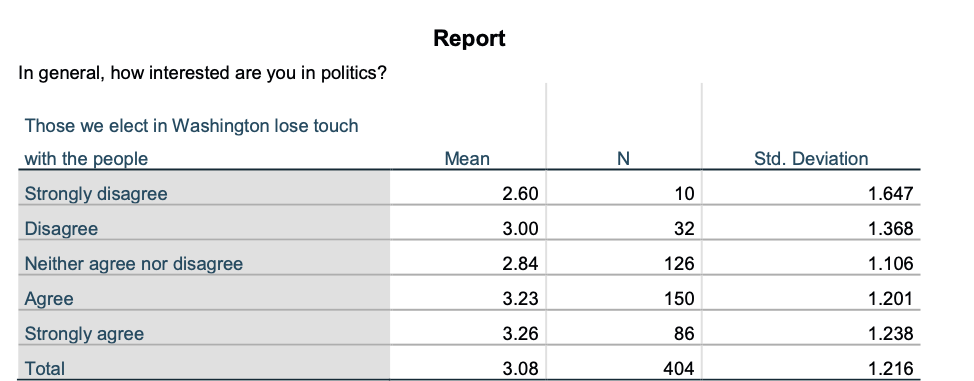 Figure 1: 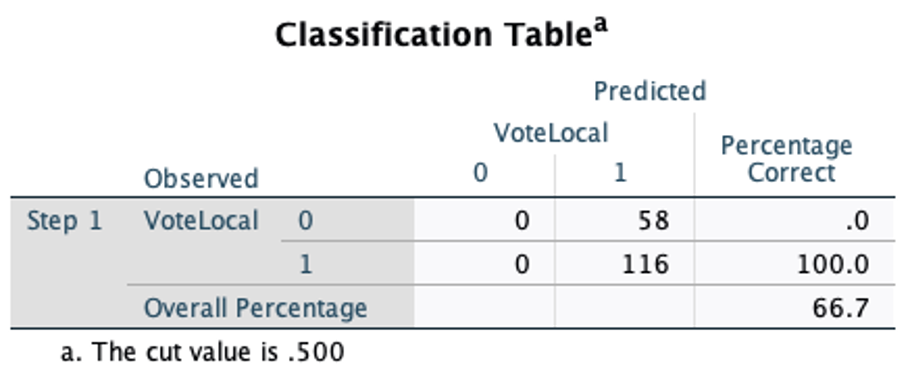 Figure 2: 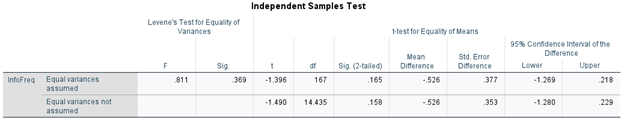 Table 2: 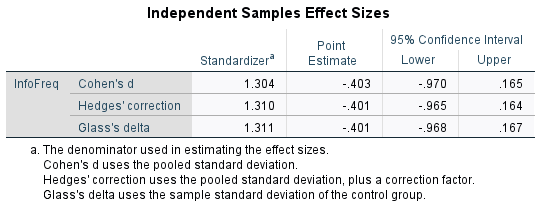 From this we can see that the overall mean of how interested people are in politics is equal to 3.08, meaning that overall, people are approximately very interested in politics (Table 1). As we examine Table 1 and Figure 1, we can see that as people become more dissatisfied with Washington politicians’ connection with the electorate, the mean score of the variable measuring political interest also begins to slightly increase, in general. Only when we go from “disagree” to “neither agree nor disagree” do we see a slight decrease in the level of political interest (Table 1, Figure 2). While there is an increase in the level of political interest, it is not substantial. Even though it is statistically significant at a p-value of .006, the correlation between the two variables (as determined by the Pearson correlation coefficient) was only 0.135 (Table 2). Discussion of Results: The obvious conclusion one might make with these results is that as people feel more dissatisfied with Washington politicians’ connection to their electorate, they become slightly more interested in politics. If we assume Weber's above stated conclusion to be true, then this conclusion would make sense: increased dissatisfaction of Washington politicians elicits anger and that causes people to become more interested in politics (Weber, 2013). Bibliography:
Charles, K. K., & Stephens, M. (2013). Employment , Wages , and Voter Turnout A. American Economic Journal: Applied Economics, 5(4), 111–143. Weber, C. (2013). Emotions, Campaigns, and Political Participation. Political Research Quarterly, 66(2), 414–428. https://doi.org/10.1177/1065912912449697 -Hunter Klein Hypothesis/motivation For our PAL group, we are studying voter turnout among college students because we want to find out why Fort Lewis voter turnout is so low. I decided to examine the effects of gender within the broader project of college students deciding whether or not to vote. I wanted to show the effect of gender in voter turnout. My hypothesis is that young women are more likely to vote than young men. The null hypothesis would then be that young women are not more likely to vote than young men, either the same likelihood or less likely. The independent variable that I decided to include is gender, presented as a binary male or female, of college students. The dependent variable is voter turnout, defined as the percentage of eligible voters who casts a ballot in an election. The importance of this when looking at college voting in general is that we know gender matters a lot in U.S. politics which has been studied and demonstrated a lot. Almost all the literature on gender and voting in the U.S. seems to be on the partisan divide which collectively suggests that women and young adults have a lot of the same attitudes and concerns. It is also shown that women seem to be voting at higher rates among college students although is less examined. While the project asks why college student voter turnout is so low, I wonder if female students are actually voting at higher rates because women generally vote more. There is very little research on why women vote more than men, just facts that they do. Related studies that I found are on gender differences in voter turnout among young adults ages 18-24. The first from the Center For American Women and Politics which explains why the difference between men's and women's voter turnout matters. Key findings were that in every presidential election since 1980, the proportion of eligible female adults has exceeded the eligible men who voted. This can also be seen among college students in which 46% of women voted vs. 40% of men in 2016 and 44.5% of women vs. 37.9% of men in 2012. The second study comes from the National Study of Learning, Voting, and Engagement under gender that examines data on student voting from over 10 million students enrolled in college at the time of both the 2012 and 2016 election. The findings demonstrate a gender difference in voter turnout. Description of Concepts, Data and Measurement: The concepts we used views gender as binary between male and female among college students. I'm looking at the percentage of students who voted in the last election at Fort Lewis. Data broken down by gender and does not include students too young to vote, students whose age data was not reported to clearinghouse, and records that were FERPA blocked. To evaluate the difference between these two groups, I'm going to use a t-test which allows me to compare two independent samples. In this case male student voter turnout and female student voter turnout. The t-test gives the probability that the difference between the two means is caused by chance. It's customary to say that if the probability is less than 0.05, that the difference is 'significant' and not caused by chance. The t-test is proportions has been extensively studied and is widely and successfully used in proportion data. Description of graphs: 1. The Pew Research Center findings reflect similar patterns as CAWP, showing that women consistently vote more than men in US midterm elections and that that gap has widened among young adults—in 2018, 35.3% of women 18 to 24 turned out to vote, compared with 29.5% of men 2. NSLVE findings again demonstrate a gender difference in voter turnout, this time among college students. In 2012, 48.9% of female students voted compared to 42% of male students. In 2016, 51.8% of female students voted compared to 44.6% of male students (a 7.2 percentage point difference). 3. This data comes from [September 2019 NSLVE Campus Report on Student Voting Rates for Fort Lewis College] and shows the voting records of students based on gender. The t-test based on the number of students voted and the total from each gender showed that unlike the other findings, the difference between male and female voter turnout at Fort Lewis was not big enough to be statistically significant, even though more women did vote than men. Citations: https://www.cawp.rutgers.edu/default/resources/genderdiff.pdf https://idhe.tufts.edu.nslv-data-portal https://www.pewresearch.org/fact-tank/2019/05/03/in-year-of-record-midterm-turnout-women-continued-to-vote-at-higher-rates-than-men/ https://www.people-press.org/2018/03/01/the-generation-gap-in-american-politics/ : https://www.cawp.rutgers.edu/footnotes/gender-gap-voting-setting-record-straight |