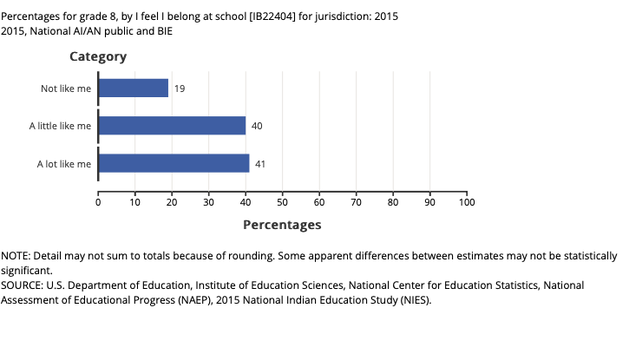
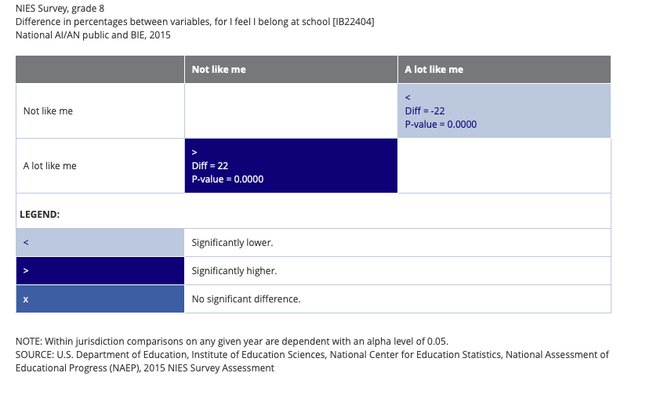
National Assessment of Educational Progress A survey done in 2015 by the NAEP (National Assessment of Educational Progress) on 8th grade students in public and BIE schools. Below is the percentage of students survey on if they feel they belong at school. Their website states "The National Assessment of Educational Progress (NAEP) is the only assessment that measures what U.S. students know and can do in various subjects across the nation, states, and in some urban districts. Also known as The Nation’s Report Card, NAEP has provided important information about how students are performing academically since 1969" (NAEP 2019). The researcher at NAEP performed a survey in 2015. They asked 8th grade population " I feel I belong at school." The response ranged from " Not like me," "A little like me," and "A lot like me." According to the graph presented by NAEP out of 100 8th grade respondent 19 answered "Not like me," 40 respondents answered " A little like me" and 41 respondent answered "A lot like me." In my analysis I wanted to determine whether my data was statistically significant. In which I wanted to look at the difference between variables of the survey done in the NEAP. In which the two variables I decided to choose were "Not like me" and "A lot like me." The p-value is 0.000 meaning I will not commit a type one error.
According to the result presented in this survey of "I feel I belong" the ones that responded to " A lot like me" is significantly higher than the ones that responded to " Not like me." The results imply that I accept my null hypothesis. Furthermore, the variables I tested do not include a correlation between a culturally safe environment and a positive school adjustment.
0 Comments
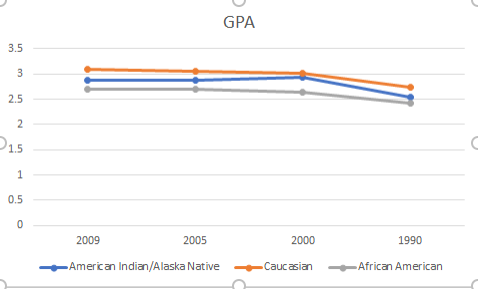
 Graduating from high school is vital for Native American students, their families, their communities, and American society. The policy in education must be changed to include Indigenous studies in curriculum for students in K-12 to benefit all students of various cultures, but more specific to Native American students. My hypothesis is culturally based education programs included in primary education curriculum increases the graduation rates of Native American high school students. My independent variable is culturally based education program’s. My dependent variable is Native American student’s academic achievement. My causal mechanism is a sense of connection so that students will learn what is being taught in curriculum. The null hypothesis is the Native American student’s achievements are not influenced by the curriculum taught in schools. David Beaulieu supports my hypothesis in his survey and assessment of culturally based education programs. Beaulieu believes “more research must be done to provide support to the need of developing standard for the education of Native American students to be represented in what is taught. There is a need to rethink policy structure in which we have been invested in since 1930s” (p. 59-60). A second study, by Pauline Rindone, admits there is insufficient attempts in investigating achievement motivation and educational attainment from an Indigenous view. In Rindone’s study, families are a major factor for student’s achievement. “Family encouragement and involvement along with traditional values are all contributing factors” to higher success rates for the Navajo participants in her study (p. 4). Native American students are in a drop-out crisis. We must motivate Native American students and prepared them to be future leaders. Our future depends on our children and our first step to helping them is the provide them with the tools to succeed. The most powerful tool for students is education. As multiple researchers have stated, there are not enough studies to provide supporting findings to express the need to change curriculum to increase graduation rates for Native American students. However, I gathered data from the National Center for Educational Statistics (NCES) to compare grade point averages among different ethnicity groups to support the need for student academic achievement, as my hypothesis states. NCES collects and analyzes education statistics from within the United States department of education and other nations. An online analysis tool provides a national report card for National Assessment of Educational Progress (NAEP) which is presented in two ways: average scale scores that represent how students performed on assessments and achievement levels which describe what students should know and be able to do. According to the scatter chart, students’ grade point average increased from all three ethnic groups from 1990 to 2000. It appears the students from the African American group are consistently below the Native American and Caucasian students. The observation of differences in GPA across racial groups may not have significance, but it provides data to support Native American students' achievement. The Native American students increased their GPA in 2000, almost equal to the Caucasian students, then dropped back down in 2005 and stayed consistently beneath a 3.0 GPA. Academic achievement for Native American students needs to be increased. The lack of culturally based education could be a factor in students' performance. Due to the absence of Indigenous views and representation, there becomes a disconnect for Native American students. This chart provides grade point averages 2.94 and below for American Indian/Alaska Native students. Although it is not specific to my variables, there is a connection to provide data for students' achievement. Beaulieu, David. “A Survey and Assessment of Culturally Based Education Programs for Native American Students in the United States.” Journal of American Indian Education 45, no. 2 (2006): 50–61.
“National Center for Education Statistics (NCES) Home Page, Part of the U.S. Department of Education.” National Center for Education Statistics (NCES) Home Page, a part of the U.S. Department of Education. Accessed November 22, 2019. https://nces.ed.gov/. Rindone, Pauline. “Achievement Motivation and Academic Achievement of Native American Students.” Journal of American Indian Education 28, no. 1 (1988): 1–8. about.jstor.org/terms. Corlette Tahhahwah 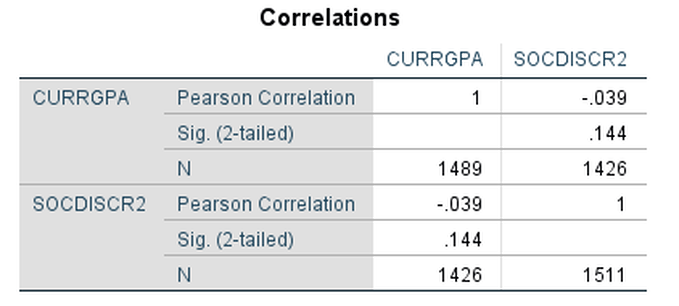 My hypothesis is that students who report a discriminatory social setting for the racial minority student population on campus have a lower grade point average than students who find the campus to be supportive. The null hypothesis is that there is no relationship between the a student's reported level of discrimination towards the racial minority student population on campus and their grade point average. Many other researchers have studied the relationship between schooling and racial minority students within the white-centric education system of the United States. In Lundberg and Lowe's study on faculty as contributors to learning for Native American students, it is shown how Native students in predominantly non-Native colleges and universities increased scores in their general education and practical competency when they had quality academic advising, viewed faculty positively, and worked harder than they thought they could to meet an instructor's expectations (Lundberg 2016). Kana'iaupuni, Ledward, and Jensen conducted a study in 2010 that examined the relationship between culture-based education and student success for Native Hawaiians. They found that culture-based education is positively related to math and reading scores of students, especially for students with lower socio-emotional development (Kana'iaupuni 2010). These findings are significant but the field is lacking general research on the impact of discrimination on academic achievement, and specifically the impact of racial discrimination on the grade point average of racial minority students. Since systemic racial discrimination is a prevalent part of the United States that reaches all aspects of daily life for racial minorities, it is vital that researches understand the impact racism has on student success. That is the first step required before the problem can be addressed. My research is a first stab at recognizing a statistically significant relationship between racial discrimination and student success. I employed data from the Gates Millennial Scholarship Program that was created by the Bill and Melinda Gates Foundation. The Scholarship Program helps students of color receive their bachelor's, master's, and doctoral degrees in computer science, education, engineering, library science, mathematics, public health, and the sciences (Gates Millennium Scholars Program). The program is administered by the United Negro College Fund and offers scholarships for up to 5 years of undergraduate studies and 4 years of graduate studies (Gates Millennium Scholars (GMS) Data). The data I used is from the surveys of the 1st cohort of students in 2000 who either had the scholarship or were offered the scholarship that had a grade point average of 3.3-4.0 and are eligible for the Pell Grant (Gates Millennium Scholars (GMS) Data). 1,426 students responded to the questions about both the levels of social discrimination experienced and their current grade point averages. I specifically used the data from the first survey these students took when they were freshmen. My independent variable, the level of racial discrimination experienced by a student, is measured with the survey question, "I find the social setting of my university or college for racial minority student populations is (4) very discriminatory, (3) discriminatory, (2) supportive, (1) very supportive." My dependent variable, academic success, is measured with self-reporting of student grade point averages. The first step in my analysis was determining the statistical significance of my data. In measuring the correlation between racial discrimination on campus and grade point average, the statistics program SPSS also computed the statistical significance. As shown in the chart above, the Pearson correlation between the two variables is -.039, meaning that grade point average goes down -.039 for every 1 increase in discrimination levels. Considering that a correlation of 0 means that there is no relationship between the 2 variables at all, -0.39 is a minuscule relationship. The statistical significance is demonstrated in the chart above under sig. (2-tailed). The alpha is .144, meaning the p-value is 86%. Unfortunately, this is not a statistically significant p-value and my findings could likely be a type one error. Regardless, this data is an important first step towards documenting the relationship between racism and student success. 86% statistical significance, while not definitive, is highly suggestive since it is less than 10% away from the 95% common standard. This means that there is a 14.4% chance that my results were coincidental, but an 86% chance that there is some relationship between social discrimination and grade point average. Even if that relationship is a small negative correlation, it is just scraping the surface of a vast area of investigation yet to be addressed through more appropriate analysis and data. I input this data into a graph below to visually represent the relationship, although not statistically significant. The dependent variable, grade point average, is represented on the y-axis and the independent variable, levels of discrimination towards the racial minority student populations, is represented on the x-axis. I filtered out the responses of students who identified as white to better portray the experiences of students of color. As evidenced in the graph, grade point average goes down as levels of social discrimination go up. It is worth noting, however, that that the students surveyed in this data were selected for having a grade point average between 3.3 and 4.0. This data is not an appropriate source for further research on discrimination and student success since it does not accurately represent the entirety of the student population who identifies as a racial minority. It is also important to keep in mind that the findings were not statistically significant. I fail to reject my null hypothesis that there is no relationship between a student's reported level of racial discrimination on campus and their grade point average.
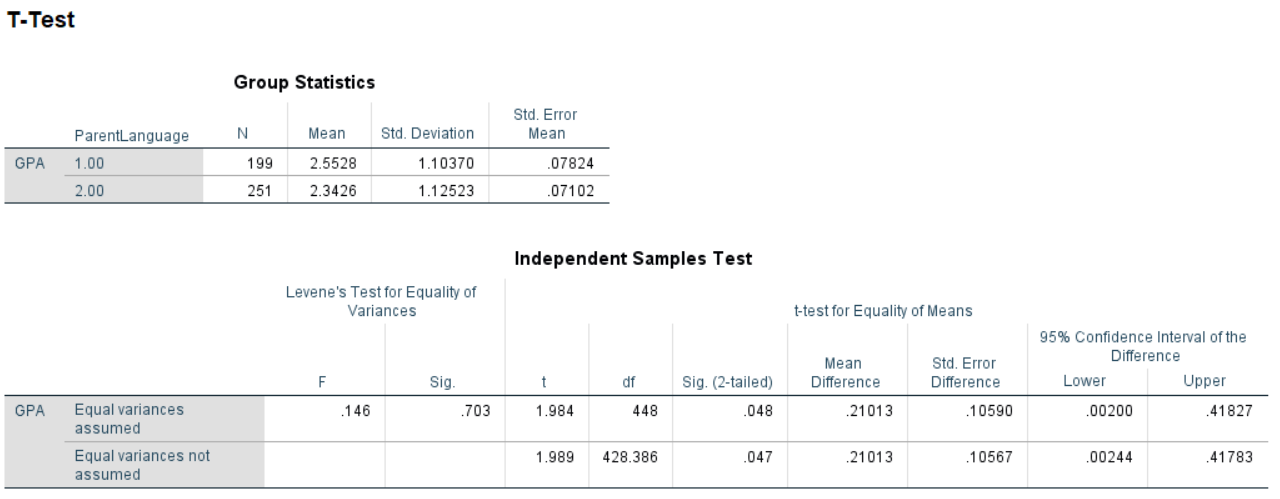
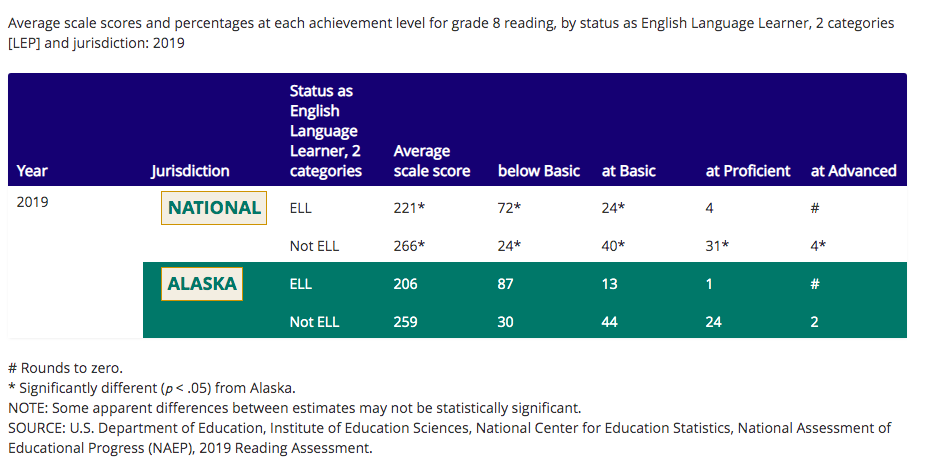
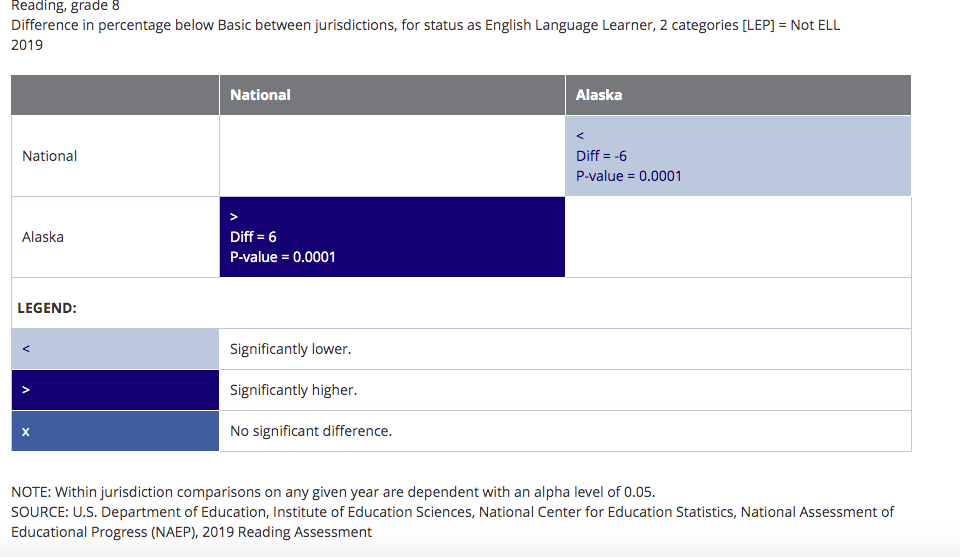
“Gates Millennium Scholars Program.” GMS. Accessed November 22, 2019. https://gmsp.org/a-gates-millennium-scholars-program/. “Gates Millennium Scholars (GMS) Data.” Series Page. Accessed November 22, 2019. https://www.icpsr.umich.edu/icpsrweb/ICPSR/series/261. Kana'iaupuni, Shawn, Brandon Ledward, and 'Umi Jensen. “Culture-Based Education and Its Relationship to Student Outcomes.” Culture-Based Education Research Resources. Kamehameha Schools, September 2010. https://www.ksbe.edu/research/research_collection/cberr/. Lundberg, Carol A., and Shelly C. Lowe. "Faculty as Contributors to Learning for Native American Students." Journal of College Student Development 57, no. 1 (2016): 3-17. doi:10.1353/csd.2016.0003. Educational success and the impact of parental involvement: the language barrier (Liza Doppler)11/18/2019 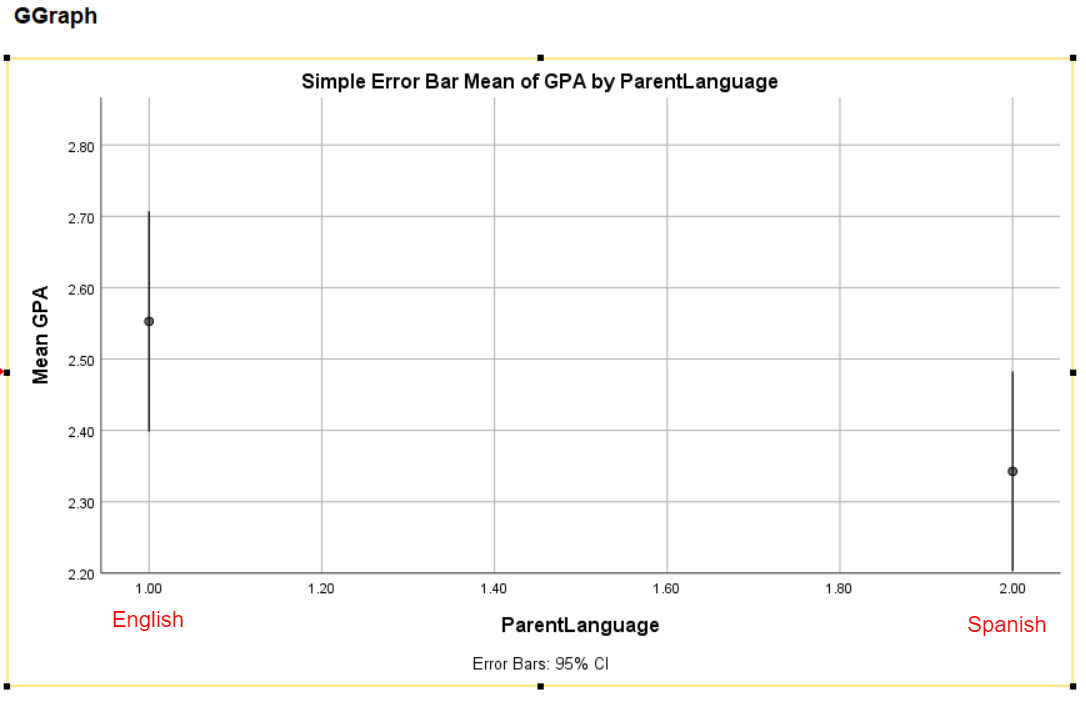 There is significant research that supports parental involvement and its positive impact on student success in school. Diverse families are at a disadvantage trying to give their children the best possible chance for knowledge attainment because they cannot actively participate in their children's learning if they do not speak the same language as the curriculum being taught. This is why I have chosen to research if there is statistical significance in the difference between the GPA mean of these students and students whose parents speak the same language as the schools. The education system should address this discrepancy to allow all students equal and equitable opportunity to learn and succeed. Educational attainment and student success are impacted by many factors. I believe that one of these factors is parental involvement in a child's schooling. My hypothesis is that the language a student's parents speak impacts the student's GPA. The independent variable of parental language affects the dependent variable of student GPA because language, whether similar or different to what is spoken in a student's school compared to what is spoken by a student's parents at home, impacts the role of parental involvement in the student's learning experience. Based on other studies' findings, parent involvement is positively correlated with student grades (Gonzalez et al., 2013). This leads me to believe that the parental language compatibility or discrepancy either allows or hinders parent involvement in the child's educational experience and affects their success. The null hypothesis is that parental language has no effect on a child's GPA. A study done by L. M. Gonzalez et al. states, "Research has shown positive associations between parental involvement and student grades," (2013). This study also acknowledged barriers that are associated with Latino families, such as language, stating schools may have "exclusionary practices such as monolingual communications or limited attempts at outreach to Spanish-speaking parents," (Gonzalez et al., 2013). My research focused on a purely Hispanic student sample with both students whose parents speak English and those whose parents speak Spanish. A similar study done by F. Doucet hypothesizes that "the highly ritualized nature of parent involvement practices creates a group identity among mainstream parents and schools that marginalizes diverse families," (2011). This author states that language, among other characteristics, "is an important trait that facilitates or obstructs access to the "insider" knowledge - or rules - necessary to successfully navigate the U.S. educational system," (Doucet, 2011). Doucet found that fathers were more involved than mothers of Haitian immigrant students due to the cultural family role, but more important to my research, the fathers' increased proficiency in the English language (2011). These studies both support that language, among other variables, is a barrier to diverse families, more specifically parents, and their involvement in their children's education; this language barrier can hinder student academic success by impeding parental involvement in a child's schooling. These prior studies' findings support the idea that there is a positive correlation between parent involvement in a student’s education and student’s academic success. The language barrier between a student’s education and the language his/her parents speak hinders parental involvement in their child’s education, making parents unable to actively participate in their child’s learning experience as much as parents who speak the same language as the school could, blocking them from helping their children or getting involved in school functions like PTA or PTO programs, volunteering to chaperone field trips, etc. By addressing this barrier and considering the implementation of alternative mechanisms to increase parent involvement for diverse families, the educational system could increase the likelihood of success of these diverse students already at a disadvantage due to the parental language barrier. The data I used to conduct my research was taken from the Bill and Melinda Gates Foundation Scholarship 2000-2008 dataset on ICPSR (2019). This scholarship is awarded to high-achieving ethnic minority student in the United States pursuing higher education. This sample represents the first 10 years of students who received the scholarship and took this survey that contributed to the information found in the data. I manipulated the dataset to display only Hispanic students who were awarded the scholarship. I then filtered the data to show only the independent variable of "language of the students' parent(s)" and the dependent variable of "current GPA," out of the many variables available within the data (GMS, 2019). The number that represented parent language as English was 1 and the number that represented Spanish was 2 on the graph as well as in the image of group statistics. The GPAs of students were measured on a 4-point scale. After manipulating the data to test for a difference in GPA means between students with parents who speak Spanish compared to English out of the purely Hispanic student sample, the descriptive statistics showed a statistical significance of 95.3% (GMS, 2019). The difference between the GPA means of students whose parents speak English (GPA mean: 2.5528) and Spanish (GPA mean: 2.3426) allowed me to support the rejection of the null hypothesis and therefore support the hypothesis that parental language impacts student GPA (2019). Language is not the only factor contributing to parent involvement in students' schooling. Socioeconomic status, work schedule of parents, cultural norms, and other factors associated with diverse families can impact parent involvement as well. However, the results of my research help me to support the notion that language may play a role in parent involvement in a child's education and therefore may impact the academic success of students. Bill and Melinda Gates Foundation. Gates Millennium Scholars (GMS) Survey Data Cohort 1, United States, 2000-2008. Ann Arbor, MI: Inter-university Consortium for Political and Social Research [distributor], 2019-03-28. https://doi.org/10.3886/ICPSR34375.v2 Doucet, F. (2011). Parent Involvement as Ritualized Practice. Anthropology & Education Quarterly, 42(4), 404-421. Retrieved from www.jstor.org/stable/41410143 Gonzalez, L., Borders, L., Hines, E., Villalba, J., & Henderson, A. (2013). Parental Involvement in Children's Education: Considerations for School Counselors Working with Latino Immigrant Families. Professional School Counseling, 16(3), 185-193. Retrieved from www.jstor.org/stable/profschocoun.16.3.185 English Language Learning (ELL) Student Achievement in Rural Regions |
AuthorWrite something about yourself. No need to be fancy, just an overview. ArchivesCategories |
 RSS Feed
