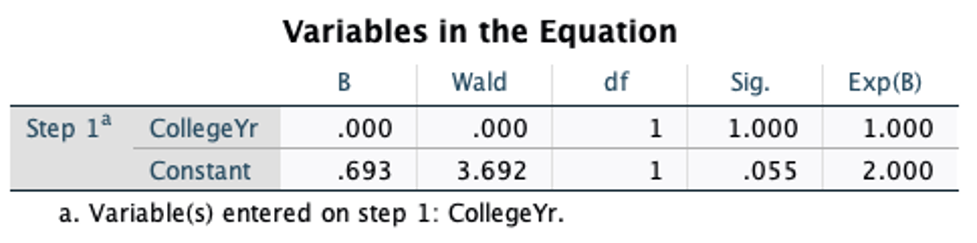
 Desiree' Brown Hypothesis and Motivation: I want to better understand civic engagement and the relationship is has with a college student’s educational levels. My research will help readers understand the variables such as year a student is in college and if they participated in the last local election. By exploring how differences in college education impact whether someone votes or not, readers will gain better insight to the reasons that lead to less voter participation of lower college level students. My research focused on data from a Political Analysis survey conducted on students at Fort Lewis College in order to critically analyze the variables and their potential correlation. Null Hypothesis: There is no correlation between voter participation and students of different education levels. Alternative Hypothesis: There is a significant correlation between civic engagement and students of different education levels. Variables: I analyzed the response data from a question on the Fort Lewis Political Analysis survey asking if participants voted in the last local election or not [VoteLocal]. This was my dependent variable. I also analyzed the education level with the response data from the question on the Fort Lewis Political Analysis survey asking what year in college the participants were [CollegeYr]. The college year of participants was my independent variable. This cross analysis was done to better understand and measure how rates of civic engagement vary by different college education level. Literature: I examined literatures such as, Are there civic returns to education? by Thomas S. Dee. In this study, evidence is presented for identifying the effects of educational attainment. One is based on the availability of junior and community colleges; the other, on changes in teen exposure to child labor laws. The one I focused on was the one presented for identifying the effects of educational attainment on voter turnout. The results suggest that educational attainment has large and statistically significant effects on subsequent voter participation and support for free speech. One interesting thing to note is, as without survey data, Dee’s selection was also narrowly tailored to a four-year college and produced a potential bias as we saw in our data set. Due to these unobserved variables of lower education levels and graduate school education levels, our data wasn’t as reliable as it could be. Another article I looked at for my research was, Democracy, Civic Participation, and the University: A Comparative Study of Civic Engagement on Five Campuses by Susan Ostrander. This article discusses the topic I’m interested in of comparing what universities are currently doing in relation to civic engagement. “This research is a comparative study of civic engagement on five campuses. Based on site visits, interviews on campuses and in host communities, document analysis, and literature reviews, four key findings emerged: (a) shifting and varying emphases in main com- ponents of engagement; (b) local factors that facilitate and present barriers to engagement; (c) intellectual rationales and projects to drive new knowledge, involve faculty, and institutionalize and sustain engagement; and (d) new organizational structures to link the campus and community and share power and resources”(Ostrander 74). Concepts, Data, and Measurement Methods: Participants were given a dichotomous measurement question to either reply Yes [1] or No [0] to the prompt "Did you vote in the local election?" [VoteLocal]. Participants were given a question to identify the answer to the prompt in the form of a scale "What is your year in college?" [CollegeYr]. The available options were: first year [1], second year [2], third year [3], fourth year [4], fifth year or more [5]. The mean year of college for the 174 participants was 2.34 years. While running cross analysis on the data from [VoteLocal] and [CollegeYr] responses, I used a binary regression and found there was no statistical significance. I had a zero binomial so that supports the null hypothesis that there is no correlation of college year and whether you voted in the last local election. I believe the issue with statistical data is that we had such a small survey and narrow selection of people surveyed. Conclusion: After evaluating the results of Fort Lewis's Political Analysis survey, I was unable to find evidence of statistical significance indicating a link between education level and civic engagement. Therefore, I am unable to accept my alternative hypothesis that there is a significant correlation in civic engagement from students of different education levels. This study had a risk of data bias due to my variables including politically active participants being more likely to take a political analysis survey than the rest of the population. This led to an imbalanced representation of civic engagement since the survey was circulated amongst college students and political science majors mostly. Narrow selection of people who took the survey due to data coming from only the Fort Lewis campus, and misrepresentations of data because there was no way to check if the people who said they voted in the last local election actually did. The results found in this research do not reflect data found in studies. If there was more time, resources, and population variation we might have had a better outcome. It is still important to reflect on this information in order to understand what kind of variables impacted this specific research and data in order to give other scholars an idea of what not to do in the future. Works Cited Dee, T. S. (2004). Are there civic returns to education? Journal of Public Economics. https://doi.org/10.1016/j.jpubeco.2003.11.002 Ostrander, Susan. ARTICLE Democracy, Civic Participation, and the University: A Comparative Study of Civic Engagement on Five Campuses. journals.sagepub.com/doi/pdf/10.1177/0899764003260588. 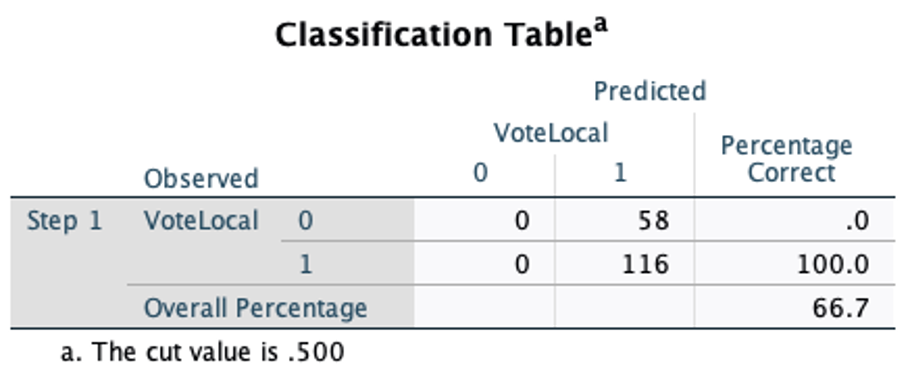
0 Comments
by Abby Fingerlin Hypothesis and MotivationThrough my research I sought to gain a better understanding of the relationship between civic engagement, education level, and familial income. My research is intended to help readers understand the weight and implications of variables such as education level and familial income on rates of voter turn out. By exploring how societal disparities impact voting, readers can gain better insight to the conditions that potentially lead to under representation of marginalized groups in politics. My research focused on extrapolating data from a Political Analysis survey conducted on students at Fort Lewis College in order to critically analyze the stated variables and their potential significance. Null Hypothesis: There is no variation in civic engagement from students of different education levels when controlling for familial income. Alternative Hypothesis: There is a statistically significant variation in civic engagement from students of different education levels when controlling for familial income. Variables StudiedIn my research, I utilized response data from a question on the Fort Lewis Political Analysis survey asking if participants were voting or not [Vote2020YN]. This served as my dependent variable. I cross examined the rates of voter turn out with information on participant's education level, which was figured through another question on the survey which asked the current year of college the participants were in [CollegeYr]. The college year of participants acted as my independent variable. This cross analysis was done with the hope to better understand and measure how rates of civic engagement vary by education level. In my data analysis I controlled for parental income [ParentSES], in attempt to understand the weight of income as a causal mechanism for accessing higher education and likelihood to vote. Literature AnalysisIn preparation for my research I evaluated works such as Are there civic returns to education? by Thomas S. Dee. In his research Dee presented indication of a statistically significant relationship between access to more education and civic engagement. His literature exhibited evidence that higher levels of education are associated with substantial increases in voter turn out. Dee's research explicitly considered family income as a latent variable because it is believed to impact both access to education and civic engagement (Dee). It is interesting to note that Dee's study included a statement of concern regarding the inclusion of "proximity to a 4-year college" as a variable, this was due to the potential for data bias. He explained that due to the "unobserved determinants of both educational attainment and civic behavior. In particular, the unobserved traits of communities near colleges (e.g., high socioeconomic status) could simultaneously encourage both higher educational attainment and increased civic participation" (Dee). This point raised concern for potential data bias in Fort Lewis's survey, due to the study having been conducted primarily on a college campus. A study comprised of participants from a single college campus is not necessarily representative of the general population, which may lead to skewed results. Another resource I explored for my research includes Do Surveys Overestimate or Underestimate Socioeconomic Differences in Voter Turnout? Evidence from Administrative Registers by Hannu Lahtinen, Pekka Martikainen, Mikko Mattila, Hanna Wass, and Lauri Rapeli. This study evaluated the potential impact of nonresponse bias to underestimate the influence of socioeconomic factors on civic participation. This study attempted to minimize potential for misreporting by using a register linked survey with information on the education, occupational social class, income, and voting of both respondents and nonrespondents. I was interested in this literature because it evaluated both education level and income to analyze voter turnout rates, along with taking nonrespondents into consideration. The results of this study indicated that nonresponse bias potentially leads to not only a significant overestimation of the overall level of turnout, but also an underestimation of educational and income-related differences in civic engagement. This study supports the hypothesis that access to opportunities for higher education and civic engagement are likely impacted significantly by income. Concepts, Data, and Measurement MethodologyParticipants were given an ordinal dichotomous measurement question to either reply Yes [1] or No [0] to the prompt "Are you voting in the 2020 Presidential election?" [Vote2020YN] In the data reported in the Fort Lewis Political Analysis survey, only 6 participants (3.4%) responded that they were not voting in the Presidential election. 154 participants (88.0%) responded that they were voting in the election. It is worth noting that these results are statistically different from rates of civic engagement in the general population of the United States. Participants were given a likert scale question to identify the answer to the prompt "What is your year in college?" [CollegeYr]. The available options were: first year [1], second year [2], third year [3], fourth year [4], fifth year or more [5]. The mean year of college for the 174 participants was 2.34 years. Participants were given a likert scale question to identify the answer to the prompt "What do you estimate your parents' socioeconomic status to be?" [ParentSES]. The available options were: lower class [1], lower middle class [2], middle class [3], upper middle class [4], upper class [5], don't know/ prefer not to answer [.]. The mean response of 168 participants was 2.87, middle class/upper middle class. It is notable that these results are statistically different from the averages of reported income in the general population of the United States. While running cross tabs analysis on the data from [Vote2020YN] and [CollegeYr] responses while controlling for [ParentSES], the resulting Sig. values on the Omnibus Test of Model Coefficients and Variables in the Equation reflect that there is no statistical significance found to correlate the analyzed variables. Because the Sig. values are above the threshold of statistical significance (0.05), we can conclude that there is no correlation found in the Fort Lewis Political Analysis survey between a person's civic engagement and their college year when controlling for familial income. It is worthy of nothing that there is potential for data bias due to survey limitations. 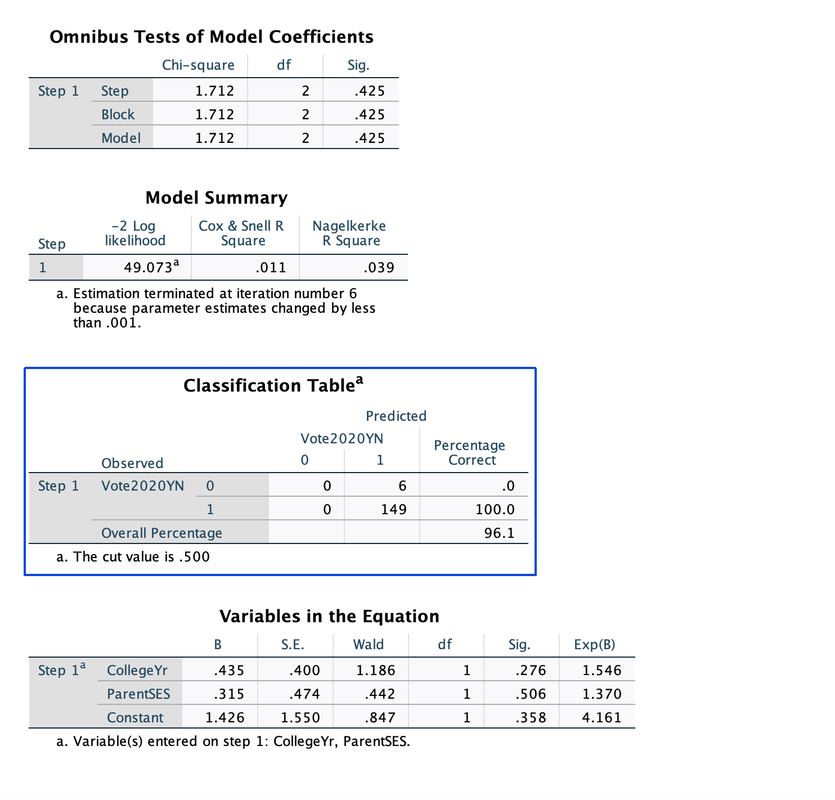 Analysis and ResultsEvaluating the results of Fort Lewis's survey, I was unable to find evidence of statistical significance indicating a link between education level, familial income, and civic participation. As a result, I am unable to accept my alternative hypothesis that there is a statistically significant variation in civic engagement from students of different education levels when controlling for familial income. It is noteworthy that the study has risk of data bias due to variables including: politically active participants being more likely to take a political analysis survey than the average population leading to unbalanced representations of civic participation, limitations of scope due to data coming from a single college campus, and misrepresentations of familial income due to self reporting. The results found in this research do not reflect data found in studies with more: time, funding, resources, and population variation. It is still important to reflect on this information in order to understand what kind of variables impact the integrity of research and data in order to prevent misrepresentation in the future. Works CitedThomas S. Dee, Are there civic returns to education?, Journal of Public Economics, Volume 88, Issues 9–10, 2004, Pages 1697-1720, ISSN 0047-2727, https://doi.org/10.1016/j.jpubeco.2003.11.002.
Hannu Lahtinen, Pekka Martikainen, Mikko Mattila, Hanna Wass, Lauri Rapeli, Do Surveys Overestimate or Underestimate Socioeconomic Differences in Voter Turnout? Evidence from Administrative Registers, Public Opinion Quarterly, Volume 83, Issue 2, Summer 2019, Pages 363–385, https://doi.org/10.1093/poq/nfz022 Sal Sharp I am studying how people's perceptions of their own financial situation affect their likelihood to vote in presidential elections. I am focusing on this because I want to find out if it has a measurable effect on the level of student voting engagement in U.S. presidential elections at Fort Lewis College. My research will help readers to better understand the causal factors that impede students from voting and specifically it will aid in measuring the reasons that prevent Fort Lewis College students in voting in U.S. presidential elections. Null Hypothesis: Perceived financial comfortability has no effect on one’s likeliness to vote in presidential elections. Alternate Hypothesis: Higher perceived financial comfortability increases the likelihood of a person to vote in presidential elections. Literature Synthesis: When examining factors that lead to increases or decreases in civic engagement, it is important to note that there is not one sole factor. There are many things that can affect civic engagement trends or an individual’s likeliness to be civically engaged. One broad category that encompasses many factors that influence civic engagement is finance, or money. Income inequality has been identified by many studies as being a very important factor that affects voter turnout. Income inequality describes the extent of an uneven distribution of income among a population. Higher levels of income inequality decrease political interest and election participation in all but the most affluent wealthy citizens in democracies (Solt, 2008). According to one study, greater income bias in turnout (larger numbers of affluent voters and less of low-income voters) will lead to higher levels of income inequality (Avery, 2015). The interests of the non-voters are not represented by the elected officials (Avery, 2015). This cycle is a positive feedback loop. Greater income inequality leads to less low-income voter participation and less low-income voter participation leads to greater income inequality. To understand why this happens as it does and to try to learn how to break the cycle, we must look at the reasons for which the lower income population does not vote as often. One study conducted in-depth interviews with members of the lower financial bracket about their civic participation and challenges that often impede them from voting. Participants discussed numerous hindrances including a lack of time, family care issues, divorce issues, problems with neighbors, a lack of community groups, and isolation because of a lack of transportation (McBride et al, 2006). Lack of time issues were typically due to participants working many jobs or long hours (McBride et al, 2006). When it comes to examining the history of research of class research one cannot overlook (Hodge, Treiman 1968). It was a critical look at how individual’s class identify and further it made the crucial finding that socioeconomic variables account for the zero-order associations of race and union membership with class identification. Indexes based upon the occupational levels of one's friends, neighbors, and relatives make independent contributions to one's class identification which are no less important than those made by education, occupation, and income. Thus, class identification rests not only upon one's own location in the status structure but upon the socioeconomic level of one's acquaintances. This is to showcase how class identification is an inherently individual concept and the main factors of it can never be gleaned by simply looking at a person’s net worth and place of living. To truly understand if one is feeling financial stress or strain one must actually ask questions relating to it, not simply try to use other figures and make the stress a latent variable and not one worth examining within itself. This is further supported by the more recent research. (Anderson, Yaish 2016) Which further supports the seminal findings. One novel finding is that, “We find a strong positive relationship between national-level inequality and opinions on how much inequality there ought to be in the income distribution.” This may be worth further opinion research in the future as the role of class identification, stress, and political engagement are examined. Methods: To test my hypotheses, I used a few different methods. First, I used a binary logistic regression to correlate my independent and dependent variables. For my dependent variable I chose Vote2020YN. This is a dichotomous variable, meaning that there were only two available answers: Yes, or No. For my independent variable, I chose to use FinComf. This variable was measured using a likert scale from 1-7 and analyzed the participant's personal financial comfortability. After this, I decided to use the same process but switch my independent variable to TimeVote. This variable used the same likert scale and examined whether the participant felt that they had enough time to vote. Finally, I performed one more regression which correlated Vote2020YN with both independent variables. I thought that these variables would be the most pertinent to my research question and hypothesis. Results: 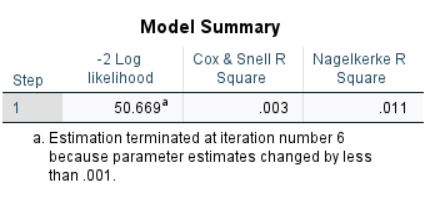 This shows the Model Summary of the regression of Vote2020YN and FinComf. The Cox and Snell R Square shows that in this case only 0.3% of the variation can be explained by the input variables. 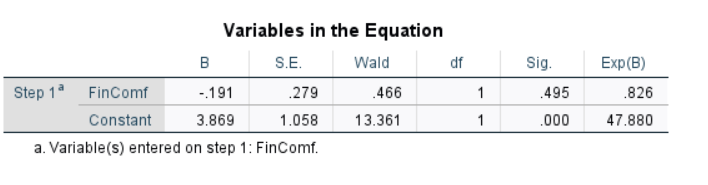 This table displays the correlation of FinComf to Vote2020YN. The Sig. is 0.495, which means that there is essentially a 49.5% chance that any statement made regarding the two variables together is incorrect. 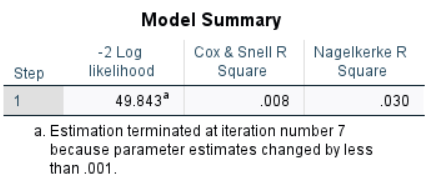 This table is the Model Summary of the regression of TimeVote and Vote2020YN. The Cox and Snell R Square value indicates that 0.8% of observed variation can be explained by the input variables. 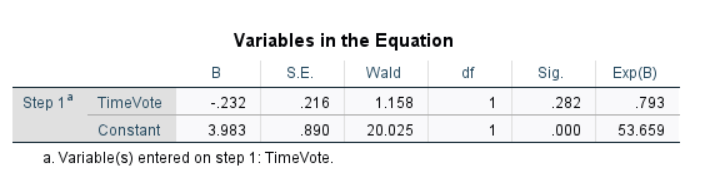 This table shows the correlation between TimeVote and Vote2020YN. The Sig. value is 0.282, which means essentially that there is a 28.2% chance of a false conclusion. 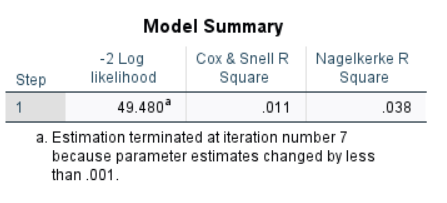 This table shows the regression when both independent variables were included (FinComf and TimeVote). The Cox and Snell R Square value indicates that 1.1% of the observed variation can be explained by the input variables. 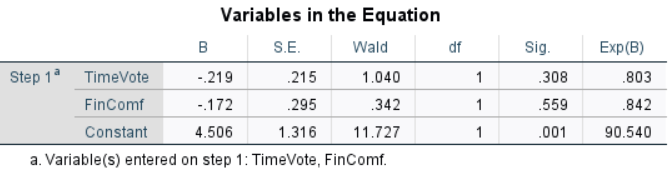 This table displays the correlation between the two independent variables (TimeVote and FinComf) and the independent variable Vote2020YN. The Sig. values are 0.308 and 0.559. This means that for TimeVote, when correlated with FinComf, there is a 30.8% chance of false conclusions, and for FinComf, when correlated with TimeVote, there is a 55.9% chance of false conclusions. Conclusion: All in all, the results that I recieved were extremely inconclusive. I failed to reject my null hypothesis in that there does not seem to be (in this study) any correlation between personal financial situation and likeliness to vote. These results have been very disappointing for me as I expected to see a higher level of correlation. I think that a larger sample size would be imperative for my study in order to exaggerate trends and create more sound conclusions. One important note is that there were only thirteen "No" responses for the Vote2020YN variablee. This is an issue of selection bias. This was a political survey about political engagement, so it is likely that people who are generally more civically engaged were more likely to take this survey. References: ANDERSEN, R., & YAISH, M. (2018). Preferences for the Distribution of Incomes in Modern Societies: The Enduring Influence of Social Class and Economic Context. Canadian Public Policy / Analyse De Politiques, 44(2), 190-205. doi:10.2307/90022701 Solt, F. (2008). Economic inequality and democratic political engagement. American Journal of Political Science, 52(1), 48–60. https://doi.org/10.1111/j.1540-5907.2007.00298.x Hodge, R., & Treiman, D. (1968). Class Identification in the United States. American Journal of Sociology, 73(5), 535-547. http://www.jstor.org/stable/2775556 Avery, J. M. (2015). Does Who Votes Matter? Income Bias in Voter Turnout and Economic Inequality in the American States from 1980 to 2010. Political Behavior, 37(4), 955–976. https://doi.org/10.1007/s11109-015-9302-z McBride, A., Sherraden, M., Pritzker, S. (2006). Civic Engagement among Low-Income and Low-Wealth Families: In Their Words. Family Relations 55, no. 2 (2006): 152-62. http://www.jstor.org/stable/40005326. Written By: Sal Sharp |
